 |
REPORT
2023s |
May
2026 |

Acknowledgements
IOGP would like to thank those companies that have participated in the data collection programme. This Report was produced by the Safety Committee.
Feedback
IOGP welcomes feedback on our reports: publications@iogp.org
Disclaimer
Whilst every effort has been made to ensure the accuracy of the information contained in this publication, neither IOGP nor any of its Members past present or future warrants its accuracy or will, regardless of its or their negligence, assume liability for any foreseeable or unforeseeable use made thereof, which liability is hereby excluded. Consequently, such use is at the recipient’s own risk on the basis that any use by the recipient constitutes agreement to the terms of this disclaimer. The recipient is obliged to inform any subsequent recipient of such terms.
Please note that this publication is provided for informational purposes and adoption of any of its recommendations is at the discretion of the user. Except as explicitly stated otherwise, this publication must not be considered as a substitute for government policies or decisions or reference to the relevant legislation relating to information contained in it.
Where the publication contains a statement that it is to be used as an industry standard, IOGP and its Members past, present, and future expressly disclaim all liability in respect of all claims, losses or damages arising from the use or application of the information contained in this publication in any industrial application.
Any reference to third party names is for appropriate acknowledgment of their ownership and does not constitute a sponsorship or endorsement.
Copyright notice
The contents of these pages are © International Association of Oil & Gas Producers. Permission is given to reproduce this report in whole or in part provided (i) that the copyright of IOGP and (ii) the sources are acknowledged. All other rights are reserved. Any other use requires the prior written permission of IOGP.
These Terms and Conditions shall be governed by and construed in accordance with the laws of England and Wales. Disputes arising here from shall be exclusively subject to the jurisdiction of the courts of England and Wales.
|
REPORT
2023s
|
May
2026
|
Revision history
| VERSION | DATE | AMENDMENTS |
|---|---|---|
| 1.00 | May 2026 | 3rd draft |
Table of contents
Contributing companies
The safety statistics were derived from data provided by the following companies:
Introduction
The International Association of Oil and Gas Producers (IOGP) has been collecting safety incident data from its Member Companies globally since 1985. The data collected are entered into the IOGP safety database, which is the largest database of safety performance in the upstream industry.
The principal purpose of the data collection and analysis is to record the global safety performance of the contributing IOGP Member Companies on an annual basis. The submission of data is voluntary and is not mandated by IOGP Membership. The annual reports provide trend analysis, benchmarking, and the identification of areas and activities on which efforts should be focused to bring about the greatest improvements in performance.
The IOGP incident reporting system covers worldwide upstream operations, both onshore and offshore, and includes incidents involving both Member Companies and their contractor employees.
The key indicators presented are:
- number of fatalities
- fatal accident rate
- fatal incident rate
- total recordable injury rate
- lost time injury rate
- number of lost work day cases
- number of lost work days
- number of restricted duty cases
- restricted duty days
- number of medical treatment cases
The analysis presents contributing IOGP Members’ global results for these indicators, which are then analysed by region, function, and company. A code is used to preserve the anonymity of the reporting company, which will typically report its own data as well as that of its associated contractors (see Appendix C).
In 2010, data collection was initiated to capture 'causal factors' associated with fatal incidents and high potential events. These data are presented in section 2.11 of this Report. Wherever practicable, results are presented graphically.
The data underlying the charts are presented in Appendix B. The causal factors and chart data are available in editable format to logged in IOGP Members.
Narrative descriptions for the fatal incidents and high potential events selected for their learning value that were reported by participating IOGP Member Companies can be found at https://data.iogp.org/Safety/FatalIncidents and https://data.iogp.org/Safety/HighPotentialEvents respectively.
Scope of reporting and data validation
The data requested from participating IOGP Member Companies are published in an annual User Guide, which contains definitions and the scope of the safety data submission. This document is also available from the IOGP publications library at https://www.iogp.org/bookstore/.
The safety data submission process is used for the collection of data relating to safety performance, process safety performance, and motor vehicle crashes. The IOGP safety database has built-in data validation requirements and each company data submission is validated by the IOGP Secretariat and the work group (Safety Committee, Subcommittee, or Expert Group) responsible for the data set in accordance with the IOGP data collection and reporting procedure. Any communication with reporting companies is conducted by the IOGP Secretariat and any data validated by an IOGP work group is blind coded to preserve the anonymity of the reporting companies.
A self-assessment questionnaire is included within the data submission process to determine the alignment between the requested data and the company submissions. The information provided in this questionnaire is also used in the validation process. Data that appear to be incorrect and that cannot be confirmed by the submitting company as correct may be excluded from the data set at the discretion of the Secretariat.
Notable changes to the data request include:
- The fatal incident activity category “Excavation, trenching, ground disturbance” was added in 2019.
- The incident cause category of “Dropped objects” was added in 2018. The categories “Caught in, under or between” and "Struck by" were modified to exclude dropped objects.
- The incident cause category of "Aviation Accident" was introduced in 2016. Aviation accidents were previously included in the "Other" incident category.
The scope of data included within this Report is detailed in Appendix A.
Data series
Other IOGP Data Reports published annually include:
- Fatality and permenent impairment injury data.
- Aviation safety data.
- Environmental performance indicators.
- Health performance indicators.
- Motor vehicle crash data.
- Process safety event data.
Additionally a Fatality and Permanent Impairment report was published in 2025 for 2022 and 2023 data.
These are available from the IOGP website http://www.iogp.org/bookstore.
Environmental performance indicators, Process safety events, Motor vehicle crash data, Health performance indicators, and the Safety performance indicators published in this Report are also available in electronic format in IOGP's data website at https://data.iogp.org/.
1. Summary of 2023 results
This section summarizes the safety performance of contributing IOGP Member Companies for 2023.
The key performance indicators (KPI) used to benchmark safety performance in this section are:
- number of fatalities
- fatal accident rate (FAR)
- total recordable injury rate (TRIR)
- lost time injury rate (LTIR)
Third party fatalities are not included in this analysis.
Fatal accident rate (FAR):
The number of company/contractor fatalities per 100 million hours worked.
Total recordable injury rate (TRIR):
The number of recordable injuries (fatalities + lost work day cases + restricted work day cases + medical treatment cases (MTC)) per million hours worked. Note when MTC are not reported by a company for a country the associated fatalities, lost work day cases and restricted work day cases are excluded from TRIR calculations.
Lost time injury rate (LTIR):
The number of lost time injuries (fatalities + lost work day cases) per million hours worked.
1.1 General
The safety performance of contributing IOGP Member Companies in 2023 is based on the analysis of 3,291 million work hours of data.
Submissions were made by 58 of the 71 operating company IOGP Members.
The data reported cover operations in 92 countries.
The resulting fatal accident rate (FAR) was 0.82, 36% lower than last year’s figure (1.28).
1.2 Fatalities
Against the background of a 28% increase in work hours reported, the number of fatalities has decreased from 33 in 2022 to 27 in 2023. The 27 fatalities occurred in 17 separate incidents. The resulting fatal accident rate (FAR) was 0.82, 36% lower than last year’s figure (1.28). The company and contractor FAR were 0.68 and 0.87 respectively. Onshore and offshore FAR were 0.90 and 0.59 respectively.
Each reported fatal incident is allocated a work activity and cause. With regard to the cause, 30% of the fatalities reported in 2023 were the result of incidents categorized as 'Assault or violent act' (8 fatalities in 2 separate incidents).
Fatalities categorized as 'Explosion, fire or burns' accounted for 19% of the fatalities, with 5 fatalities in 3 separate incidents.
4 fatalities were reported in 3 separate incidents that were categorized as 'Caught in, under or between (excl. dropped objects)' and 2 fatalities were reported in a single incident that was categorized as 'Water related, drowning'.
With regard to the activity, 26% of the fatalities reported in 2023 were the result of incidents categorized as 'Transport - Land' (7 fatalities in 4 separate incidents).
Fatalities categorized as 'Production operations' also accounted for 26% of the fatalities, with 7 fatalities in 2 separate incidents.
4 fatalities were reported in 3 separate incidents in the 'Maintenance, inspection, testing' activity, and 3 fatalities were reported in 3 separate incidents in the 'Drilling, workover, well operations' activity.
The fatal accident rate for 2023 is 0.82, 36% lower than the 2022 rate (1.28). The company-only FAR for 2023 is 0.68, 127% higher than the rate for 2022 (0.30). The Contractor-only FAR is 0.87, 46% lower than the rate for 2022 (1.62).
1.3 Total recordable injuries
The overall total recordable injury rate (TRIR) (fatalities, lost work day cases, restricted work day cases, and medical treatment cases) was 0.84, 7% lower than in 2022 (0.90).
1.4 Lost time injuries
The overall lost time injury rate (LTIR) (fatalities and lost work day cases) was 0.24, 14% lower than in 2022 (0.28).
The participating IOGP Member Companies reported 750 lost work day cases (injuries resulting in at least one day off work):
- 563 incidents were contractor related.
- 187 incidents were company related.
Participating companies reported 30,246 days of work lost through injuries.
Figure 7 shows the percentage of LWDC by cause.
- 175 cases, 23% of the total, were categorized as 'Slips and trips (at same height)': 2022 results showed 130 cases, accounting for 19% of the total.
- 'Caught in, under or between (excl. dropped objects)' accounted for 145 cases, 19% of the total (122 cases, 18% of the total in 2022).
- 'Struck by (not dropped object)' accounted for 126 cases, 17% of the total (104 cases, 15% of the total in 2022).
Figure 8 shows the percentage of LWDC by activity.
- 154 cases, 21% of the total, were categorized as 'Maintenance, inspection, testing': 2022 results showed 129 cases, accounting for 19% of the total.
- 'Drilling, workover, well operations' accounted for 133 cases, 18% of the total (142 cases, 21% of the total in 2022).
- 'Production operations' accounted for 124 cases, 17% of the total (120 cases, 18% of the total in 2022).
See Appendix B - Section 1 for data tables.
2. 2023 results
In this section, the primary indicators used to measure contributing IOGP Member Companies’ safety performance are:
- number and nature of fatalities
- total recordable injury rate
- fatal accident rate
- fatal incident rate
- lost time injury rate
Third party incidents are not included in this Report.
2.1 Fatalities
| Company/contractor | 2022 | 2023 | ||||
|---|---|---|---|---|---|---|
| Onshore | Offshore | Overall | Onshore | Offshore | Overall | |
| Company | 4 | 2 | 6 | 4 | 4 | 8 |
| Contractor | 13 | 13 | 26 | 35 | 9 | 44 |
| OVERALL | 17 | 15 | 32 | 39 | 13 | 52 |
27 company and contractor fatalities were reported in 2023. This is 6 fewer than were reported in 2022 and 7 more than in 2021.
The 27 fatalities occurred in 17 separate incidents.
2.2 Fatal accident rate
In 2023 there were 6 company fatalities (2 in 2022) as a result of 4 separate incidents.
In 2023 there were 21 contractor fatalities (31 in 2022) as a result of 13 separate incidents.
| Fatal accident rate (FAR) | Relative to 2022 FAR | ||
|---|---|---|---|
| 2022 | 2023 | ||
| OVERALL | 0.77 | 1.35 | 75% higher |
| Company | 0.57 | 0.89 | 56% higher |
| Contractor | 0.84 | 1.49 | 77% higher |
| Onshore | 0.56 | 1.34 | 139% higher |
| Offshore | 1.31 | 1.37 | 5% higher |
All hours in the database were used for calculations of fatal accident rate (FAR).
The difference between the onshore and offshore FAR displays a large variation over the 10-year period shown in Figure 11. Neither is consistently lower. This is generally attributable to single "transportation", "fire and explosion", or "assault/violent act" incidents involving high numbers of fatalities.
2.3 Fatal incident rate
The fatal incident rate (FIR) is a measure of the rate at which fatal incidents occur, in contrast to the fatal accident rate (FAR) which measures the rate of fatalities. Accordingly, for company and contractor fatalities, the FIR will be less than or equal to the FAR. Comparison of FAR and FIR gives an indication of the magnitude of the incidents in terms of lives lost.
Overall, the FIR decreased by 54% compared with last year (17 fatal incidents in 2023, 29 fatal incidents in 2022).
All hours in the database were used for calculations of FIR.
| Fatal incident rate (FIR) | Relative to 2022 FIR | ||
|---|---|---|---|
| 2022 | 2023 | ||
| OVERALL | 0.50 | 1.04 | 108% higher |
| Company | 0.57 | 0.89 | 56% higher |
| Contractor | 0.48 | 1.08 | 125% higher |
| Onshore | 0.47 | 1.03 | 119% higher |
| Offshore | 0.61 | 1.05 | 72% higher |
2.4 Fatalities by incident cause and activity
11 of the 17 fatal incidents involved one fatality. 6 incidents involved 2 or more fatalities.
| Activity | Cause | ||||||||||||||||
|---|---|---|---|---|---|---|---|---|---|---|---|---|---|---|---|---|---|
| Assault or violent act | Aviation accident | Caught in, under or between (excl. dropped objects) | Confined space | Cut, puncture, scrape | Dropped objects | Explosions or burns | Exposure electrical | Exposure noise, chemical, biological, vibration | Falls from height | Overexertion, strain | Pressure release | Slips and trips (at same height) | Struck by (not dropped object) | Water related, drowning | Other | OVERALL | |
| Construction, commissioning, decommissioning | 1 | 1 | 1 | 1 | 4 | ||||||||||||
| Diving (incl. decompression), subsea, ROV | |||||||||||||||||
| Drilling, workover, well operations | 1 | 2 | 2 | 4 | 9 | ||||||||||||
| Excavation, trenching, ground disturbance | |||||||||||||||||
| Lifting, crane, rigging, deck operations | 1 | 4 | 1 | 6 | |||||||||||||
| Maintenance, inspection, testing | 2 | 1 | 5 | 1 | 1 | 2 | 1 | 1 | 14 | ||||||||
| Office, warehouse, accommodation, catering | |||||||||||||||||
| Production operations | 1 | 1 | 2 | 1 | 5 | ||||||||||||
| Seismic/survey operations | |||||||||||||||||
| Transport - Air | 3 | 3 | |||||||||||||||
| Transport - Land | 4 | 5 | 1 | 10 | |||||||||||||
| Transport - Water, incl. marine activity | |||||||||||||||||
| Unspecified - other | 1 | 1 | |||||||||||||||
| OVERALL | 4 | 3 | 9 | 8 | 6 | 2 | 1 | 5 | 8 | 4 | 2 | 52 | |||||
| Cause | Number of fatalities | ||||
|---|---|---|---|---|---|
| 2019 | 2020 | 2021 | 2022 | 2023 | |
| Assault or violent act | 6 | 1 | 8 | 4 | 4 |
| Aviation accident | 0 | 1 | 0 | 1 | 3 |
| Caught in, under or between (excl. dropped objects) | 6 | 6 | 4 | 2 | 9 |
| Confined space | 0 | 0 | 0 | 1 | 0 |
| Cut, puncture, scrape | 0 | 0 | 0 | 0 | 0 |
| Dropped objects | 0 | 6 | 1 | 1 | 8 |
| Explosion, fire or burns | 0 | 4 | 5 | 13 | 6 |
| Exposure electrical | 1 | 0 | 1 | 2 | 2 |
| Exposure noise, chemical, biological, vibration, extreme temperature | 0 | 1 | 2 | 0 | 1 |
| Falls from height | 4 | 3 | 1 | 3 | 5 |
| Overexertion, strain | 0 | 0 | 0 | 0 | 0 |
| Pressure release | 0 | 4 | 1 | 0 | 0 |
| Slips and trips (at same height) | 0 | 0 | 0 | 0 | 0 |
| Struck by (not dropped object) | 2 | 6 | 2 | 4 | 8 |
| Water related, drowning | 1 | 1 | 2 | 1 | 4 |
| Unspecified - Other | 0 | 0 | 0 | 0 | 2 |
| OVERALL | 20 | 33 | 27 | 32 | 52 |
| Activity | Number of fatalities | ||||
|---|---|---|---|---|---|
| 2019 | 2020 | 2021 | 2022 | 2023 | |
| Construction, commissioning, decommissioning | 3 | 4 | 3 | 4 | 4 |
| Diving (incl. decompression), subsea, ROV | 0 | 1 | 0 | 0 | 0 |
| Drilling, workover, well operations | 2 | 9 | 3 | 11 | 9 |
| Excavation, trenching, ground disturbance | 0 | 1 | 0 | 0 | 0 |
| Lifting, crane, rigging, deck operations | 2 | 4 | 2 | 2 | 6 |
| Maintenance, inspection, testing | 5 | 3 | 4 | 3 | 14 |
| Office, warehouse, accommodation, catering | 0 | 0 | 0 | 0 | 0 |
| Production operations | 0 | 5 | 7 | 7 | 5 |
| Seismic/survey operations | 0 | 1 | 0 | 0 | 0 |
| Transport - Air | 0 | 1 | 0 | 1 | 3 |
| Transport - Land | 7 | 3 | 7 | 4 | 10 |
| Transport - Water, incl. marine activity | 1 | 0 | 1 | 0 | 0 |
| Unspecified - other | 0 | 1 | 0 | 0 | 1 |
| OVERALL | 20 | 33 | 27 | 32 | 52 |
2.5 Total recordable injury rate
Submissions without information on medical treatment cases were filtered out, leaving a dataset of 3,291 million hours, 100% of the database. There were 2,773 reported recordable injuries (fatalities + LWDC + RWDC + MTC where MTC are reported), which equates to an average of 53 recordable injuries every week of the year or 8 injuries every day of the year. See Appendix A – Database dimensions.
An overall decrease in TRIR of 7% is seen in 2023.
| Total recordable injury rate (TRIR) | Relative to 2022 TRIR | ||
|---|---|---|---|
| 2022 | 2023 | ||
| OVERALL | 0.81 | 0.75 | 7% lower |
| Company | 0.56 | 0.58 | 4% higher |
| Contractor | 0.89 | 0.80 | 10% lower |
| Onshore | 0.73 | 0.61 | 16% lower |
| Offshore | 1.04 | 1.20 | 15% higher |
2.6 Lost time injury rate
There were 750 reported lost work day cases resulting in at least one day off work, which equates to an average of 14 injuries resulting in at least one day off work every week of the year or more than 2 injuries every day of the year.
For calculations of lost time injury rate (LTIR), all hours in the database were used. See 2.8 Severity of lost work day cases for further information on lost work day case severity.
| Lost time injury rate (LTIR) | Relative to 2022 LTIR | ||
|---|---|---|---|
| 2022 | 2023 | ||
| OVERALL | 0.24 | 0.25 | 4% higher |
| Company | 0.21 | 0.23 | 10% higher |
| Contractor | 0.24 | 0.26 | 8% higher |
| Onshore | 0.18 | 0.18 | No change |
| Offshore | 0.39 | 0.46 | 18% higher |
2.7 Lost work day case causes and activities
| Cause | Number | % of total |
|---|---|---|
| Assault or violent act | 3 | 0.3 |
| Caught in, under or between (excl. dropped objects) | 154 | 16.8 |
| Cut, puncture, scrape | 37 | 4.0 |
| Dropped objects | 29 | 3.2 |
| Explosion, fire or burns | 56 | 6.1 |
| Exposure electrical | 8 | 0.9 |
| Exposure noise, chemical, biological, vibration, extreme temperature | 36 | 3.9 |
| Falls from height | 56 | 6.1 |
| Overexertion, strain | 70 | 7.6 |
| Pressure release | 7 | 0.8 |
| Slips and trips (at same height) | 195 | 21.3 |
| Struck by (not dropped object) | 138 | 15.1 |
| Water related, drowning | 3 | 0.3 |
| Unspecified - Other | 124 | 13.5 |
| OVERALL | 916 |
Of the 750 reported lost work day cases resulting in at least one day off work, 563 incidents (75%) were contractor-related and 187 (25%) were company-related (514 and 168 respectively for 2022).
The lost work day case cause was provided for all lost work day cases reported, although 6% of the cases were categorized as 'Other'.
Figure 23 shows the percentage of LWDCs within each of the reporting categories for 2023.
- Slips and trips (at same height) accounted for 175 cases, 23.3% of LWDCs where the cause was given. 2022 results showed 130 cases accounting for 19.1%.
- Caught in, under or between (excl. dropped objects) accounted for 145 cases, 19.3% of the total. 2022 results showed 122 cases accounting for 17.9%.
- Struck by (not dropped object) accounted for 126 cases, 16.8% of the total. 2022 results showed 104 cases accounting for 15.2%.
Results were very similar to previous years.
| Cause | Company | Contractor |
|---|---|---|
| Assault or violent act | 0 | 3 |
| Caught in, under or between (excl. dropped objects) | 33 | 121 |
| Cut, puncture, scrape | 4 | 33 |
| Dropped objects | 8 | 21 |
| Explosion, fire or burns | 5 | 51 |
| Exposure electrical | 4 | 4 |
| Exposure noise, chemical, biological, vibration, extreme temperature | 13 | 23 |
| Falls from height | 13 | 43 |
| Overexertion, strain | 22 | 48 |
| Pressure release | 1 | 6 |
| Slips and trips (at same height) | 50 | 145 |
| Struck by (not dropped object) | 26 | 112 |
| Water related, drowning | 1 | 2 |
| Unspecified - Other | 23 | 101 |
| OVERALL | 203 | 713 |
| Cause | Onshore | Offshore |
|---|---|---|
| Assault or violent act | 3 | 0 |
| Caught in, under or between (excl. dropped objects) | 80 | 74 |
| Cut, puncture, scrape | 20 | 17 |
| Dropped objects | 23 | 6 |
| Explosion, fire or burns | 26 | 30 |
| Exposure electrical | 6 | 2 |
| Exposure noise, chemical, biological, vibration, extreme temperature | 19 | 17 |
| Falls from height | 30 | 26 |
| Overexertion, strain | 36 | 34 |
| Pressure release | 6 | 1 |
| Slips and trips (at same height) | 114 | 81 |
| Struck by (not dropped object) | 78 | 60 |
| Water related, drowning | 0 | 3 |
| Unspecified - Other | 54 | 70 |
| OVERALL | 495 | 421 |
Of the 750 reported lost work day cases resulting in at least one day off work, 429 incidents (57%) were related to onshore activity and 321 (43%) were related to offshore activity (387 and 295 respectively for 2022).
Lost work day case activities were reported for all of the 750 lost work day cases reported, although 15% of the cases were categorized as 'Unspecified - Other'.
| Activity | Number | % of total |
|---|---|---|
| Construction, commissioning, decommissioning | 124 | 13.5 |
| Diving (incl. decompression), subsea, ROV | 4 | 0.4 |
| Drilling, workover, well operations | 144 | 15.7 |
| Excavation, trenching, ground disturbance | 8 | 0.9 |
| Lifting, crane, rigging, deck operations | 77 | 8.4 |
| Maintenance, inspection, testing | 173 | 18.9 |
| Office, warehouse, accommodation, catering | 62 | 6.8 |
| Production operations | 150 | 16.4 |
| Seismic/survey operations | 2 | 0.2 |
| Transport - Land | 22 | 2.4 |
| Transport - Water, incl. marine activity | 13 | 1.4 |
| Unspecified - other | 137 | 15.0 |
| OVERALL | 916 |
| Activity | Company | Contractor |
|---|---|---|
| Construction, commissioning, decommissioning | 5 | 119 |
| Diving (incl. decompression), subsea, ROV | 0 | 4 |
| Drilling, workover, well operations | 19 | 125 |
| Excavation, trenching, ground disturbance | 2 | 6 |
| Lifting, crane, rigging, deck operations | 12 | 65 |
| Maintenance, inspection, testing | 53 | 120 |
| Office, warehouse, accommodation, catering | 16 | 46 |
| Production operations | 54 | 96 |
| Seismic/survey operations | 0 | 2 |
| Transport - Land | 9 | 13 |
| Transport - Water, incl. marine activity | 0 | 13 |
| Unspecified - other | 33 | 104 |
| OVERALL | 203 | 713 |
| Activity | Onshore | Offshore |
|---|---|---|
| Construction, commissioning, decommissioning | 73 | 51 |
| Diving (incl. decompression), subsea, ROV | 0 | 4 |
| Drilling, workover, well operations | 98 | 46 |
| Excavation, trenching, ground disturbance | 8 | 0 |
| Lifting, crane, rigging, deck operations | 34 | 43 |
| Maintenance, inspection, testing | 74 | 99 |
| Office, warehouse, accommodation, catering | 32 | 30 |
| Production operations | 82 | 68 |
| Seismic/survey operations | 1 | 1 |
| Transport - Land | 22 | 0 |
| Transport - Water, incl. marine activity | 1 | 12 |
| Unspecified - other | 70 | 67 |
| OVERALL | 495 | 421 |
2.8 Severity of LWDC
IOGP Member Companies reported a total of 30,246 days lost (LWDC days) through injuries.
- The number of days lost was reported for 605 of the 750 lost work day cases reported.
- The offshore LWDC severity is 21% higher than onshore.
- The LWDC severity for contractors is 22% higher than for company employees.
| Severity of LWDC (average days lost per LWDC) | 2023 relative to 2018-2022 | 2023 relative to 2022 | |||
|---|---|---|---|---|---|
| 2018-2022 | 2022 | 2023 | |||
| OVERALL | 46.4 | 45.3 | 42.3 | 9% lower | 7% lower |
| Company | 45.6 | 50.3 | 55.0 | 21% higher | 9% higher |
| Contractor | 46.6 | 43.6 | 38.3 | 18% lower | 12% lower |
| Onshore | 46.7 | 47.5 | 42.7 | 9% lower | 10% lower |
| Offshore | 45.9 | 42.3 | 41.7 | 9% lower | 1% lower |
The figure below shows the average number of days lost per LWDC in 2023 compared with the average for the previous five-year period. A 5% increase is shown in overall LWDC severity when compared with the previous five-year period.
2.9 Severity of RWDC
For calculations of restricted work day case (RWDC) severity:
- Submissions without information on days assigned to restricted activities were filtered out, leaving a database of 2,521 million hours (77% of the total database), and 398 restricted work day cases.
- In 2022, this database was 1,847 million hours, 72% of the total database.
In total, 9,740 days were restricted (RWDC days) as a result of restricted work day cases, in the sense that normal duties could not be performed.
See Appendix A and Appendix C.
| Severity of RWDC (average days restricted per RWDC) | 2023 relative to 2018-2022 | 2023 relative to 2022 | |||
|---|---|---|---|---|---|
| 2018-2022 | 2022 | 2023 | |||
| OVERALL | 28.7 | 33.6 | 24.4 | 15% lower | 27% lower |
| Company | 31.2 | 30.0 | 22.8 | 27% lower | 24% lower |
| Contractor | 28.3 | 34.2 | 24.7 | 13% lower | 28% lower |
| Onshore | 29.3 | 33.1 | 22.4 | 24% lower | 32% lower |
| Offshore | 27.5 | 34.7 | 28.5 | 4% higher | 18% lower |
The figure below shows the average number of days restricted per RWDC in 2023 compared with the average for the previous five-year period. The overall average shows no change compared with the average for the previous five-year period.
2.10 Incident triangles
In this section, the relative numbers of types of occupational injury are shown in the form of ‘incident triangles’. The ratios have been corrected to account for the absence, in some data submissions, of medical treatment cases.
| Year | Ratio of lost time injuries to fatalities | Ratio of total recordable injuries to fatalities |
|---|---|---|
| 2025 | 19:1 | 53:1 |
| 2024 | 31:1 | 96:1 |
| 2023 | 29:1 | 103:1 |
| 2022 | 22:1 | 69:1 |
| 2021 | 30:1 | 101:1 |
| 2020 | 40:1 | 122:1 |
| 2019 | 29:1 | 110:1 |
| 2018 | 26:1 | 98:1 |
| 2017 | 24:1 | 85:1 |
| 2016 | 16:1 | 60:1 |
Lost time injuries (LTI):
Lost work day cases and fatalities.
Total recordable injuries (TRI):
Fatalities, lost work day cases, restricted work day cases, and medical treatment cases where medical treatment cases are reported for the data set.
Ratio of lost time injuries to fatalities:
The number of lost time injuries divided by the total number of fatalities (lost time injuries/fatalities).
Ratio of total recordable injuries to fatalities:
The number of recordable injuries divided by the total number of fatalities (recordable injuries/fatalities).
Incident triangles (2023)
Incident triangles (2022)
The varying ratio of fatalities to lost time injuries to recordable injuries for 2022-2023 challenges the traditional notion of recordable injuries and lost time injuries overall as a precursor to fatalities, as shown in the incident triangles.
| Cause | LTIs (fatalities + LWDCs) | Fatalities | Ratio (LTI:Fatality) |
|---|---|---|---|
| Assault or violent act | 7 | 4 | 2:1 |
| Water related, drowning | 7 | 4 | 2:1 |
| Dropped objects | 37 | 8 | 5:1 |
| Exposure electrical | 10 | 2 | 5:1 |
| Explosion, fire or burns | 62 | 6 | 10:1 |
| Falls from height | 61 | 5 | 12:1 |
| Caught in, under or between (excl. dropped objects) | 163 | 9 | 18:1 |
| Struck by (not dropped object) | 146 | 8 | 18:1 |
| Exposure noise, chemical, biological, vibration, extreme temperature | 37 | 1 | 37:1 |
| Unspecified - Other | 126 | 2 | 63:1 |
| Slips and trips (at same height) | 195 | 0 | n/a |
| Overexertion, strain | 70 | 0 | n/a |
| Cut, puncture, scrape | 37 | 0 | n/a |
| Pressure release | 7 | 0 | n/a |
| Activity | LTIs (fatalities + LWDCs) | Fatalities | Ratio (LTI:Fatality) |
|---|---|---|---|
| Transport - Land | 32 | 10 | 3:1 |
| Maintenance, inspection, testing | 187 | 14 | 13:1 |
| Lifting, crane, rigging, deck operations | 83 | 6 | 14:1 |
| Drilling, workover, well operations | 153 | 9 | 17:1 |
| Production operations | 155 | 5 | 31:1 |
| Construction, commissioning, decommissioning | 128 | 4 | 32:1 |
| Unspecified - other | 138 | 1 | 138:1 |
| Office, warehouse, accommodation, catering | 62 | 0 | n/a |
| Transport - Water, incl. marine activity | 13 | 0 | n/a |
| Excavation, trenching, ground disturbance | 8 | 0 | n/a |
| Diving (incl. decompression), subsea, ROV | 4 | 0 | n/a |
| Seismic/survey operations | 2 | 0 | n/a |
2.11 Causal factors
The allocation of ‘causal factors’ to fatal incidents and high potential events was requested as part of the data submission. IOGP first began recording causal factors in 2010. Users now have 13 years worth of data on this topic to use for comparisons.
To standardize the response, an IOGP glossary and list of causal factors was provided to Member Companies as part of the IOGP user guide. The causal factors list is divided into two sections:
- People (Acts) classifications usually involve either the actions of a person or actions which were required but not carried out or were incorrectly performed. There are four major categories of actions, with an additional level of detail under each of the major categories.
- Process (Conditions) classifications usually involve some type of physical hazard or organizational aspect out of the control of the individual. There are five major classification categories, with an additional level of detail under each of the major categories.
High potential event
An event which could have, under slightly different circumstances, realistically resulted in a fatal incident.
2.12 Fatal incident causal factors
Causal factors are divided into two separate groups, People (Acts) and Process (Conditions), see Report 2023su Safety data reporting user guide – 2023 data and Glossary for details.
- 10 of the 17 fatal incidents reported were assigned causal factors (27 of 29 in 2022).
- 23 causal factors were assigned for the 10 fatal incidents (88 in 2022).
- Between 1 and 5 causal factors were assigned per incident (between 1 and 7 in 2022).
| Causal factor group | 2022 | 2023 |
|---|---|---|
| PEOPLE (ACTS) | 22 | 79 |
| PROCESS (CONDITIONS) | 24 | 90 |
The causal factors assigned to fatal incidents are shown in Table 21. The highlighted content indicates the top ten causal factors assigned to fatal incidents in 2023 compared with the previous 9 years. 4 of the causal factors were in the top ten for the 10 years shown, and for each of the 10 years for which data were reported.
Additional information on the fatal incidents reported by region can be found at https://data.iogp.org/Safety/FatalIncidents. The information provided includes a narrative description of the incident, the corrective actions and recommendations, and the causal factors assigned by the reporting company.
| Causal factor | 2014 | 2015 | 2016 | 2017 | 2018 | 2019 | 2020 | 2021 | 2022 | 2023 | Total |
|---|---|---|---|---|---|---|---|---|---|---|---|
| PEOPLE (ACTS) : Following Procedures : Improper position (in the line of fire) | 11 | 7 | 13 | 7 | 2 | 3 | 17 | 4 | 5 | 25 | 94 |
| PROCESS (CONDITIONS) : Organizational : Inadequate hazard identification or risk assessment | 10 | 10 | 15 | 9 | 1 | 5 | 6 | 3 | 3 | 25 | 87 |
| PROCESS (CONDITIONS) : Organizational : Inadequate supervision | 9 | 12 | 17 | 7 | 4 | 5 | 5 | 1 | 4 | 8 | 72 |
| PEOPLE (ACTS) : Inattention/Lack of Awareness : Improper decision making or lack of judgment | 13 | 9 | 14 | 9 | 2 | 6 | 4 | 0 | 4 | 8 | 69 |
| PROCESS (CONDITIONS) : Organizational : Inadequate training/competence | 6 | 4 | 11 | 3 | 3 | 3 | 4 | 2 | 1 | 7 | 44 |
| PROCESS (CONDITIONS) : Organizational : Inadequate work standards/procedures | 4 | 4 | 3 | 3 | 3 | 7 | 3 | 0 | 4 | 11 | 42 |
| PEOPLE (ACTS) : Use of Protective Methods : Failure to warn of hazard | 5 | 5 | 4 | 4 | 0 | 2 | 3 | 1 | 2 | 6 | 32 |
| PEOPLE (ACTS) : Following Procedures : Deviation unintentional (by individual or group) | 2 | 6 | 5 | 5 | 2 | 2 | 4 | 1 | 1 | 4 | 32 |
| PROCESS (CONDITIONS) : Tools, Equipment, Materials and Products : Inadequate maintenance/inspection/testing | 4 | 2 | 6 | 0 | 1 | 1 | 4 | 1 | 2 | 10 | 31 |
| PROCESS (CONDITIONS) : Protective Systems : Inadequate/defective guards or protective barriers | 2 | 8 | 4 | 4 | 0 | 3 | 4 | 0 | 1 | 3 | 29 |
| PROCESS (CONDITIONS) : Organizational : Inadequate communication | 3 | 1 | 5 | 3 | 3 | 2 | 5 | 0 | 1 | 4 | 27 |
| PROCESS (CONDITIONS) : Tools, Equipment, Materials and Products : Inadequate design/specification/management of change | 1 | 2 | 3 | 1 | 1 | 1 | 6 | 1 | 2 | 7 | 25 |
| PEOPLE (ACTS) : Use of Tools, Equipment, Materials and Products : Servicing of energized equipment/inadequate energy isolation | 2 | 3 | 2 | 2 | 2 | 1 | 5 | 1 | 1 | 4 | 23 |
| PROCESS (CONDITIONS) : Tools, Equipment, Materials and Products : Inadequate/defective tools/equipment/materials/products | 3 | 5 | 2 | 1 | 1 | 2 | 1 | 0 | 2 | 5 | 22 |
| PEOPLE (ACTS) : Use of Protective Methods : Equipment or materials not secured | 2 | 1 | 4 | 2 | 0 | 2 | 1 | 0 | 0 | 9 | 21 |
| PEOPLE (ACTS) : Following Procedures : Improper lifting or loading | 2 | 0 | 6 | 2 | 0 | 1 | 3 | 1 | 0 | 6 | 21 |
| PEOPLE (ACTS) : Use of Tools, Equipment, Materials and Products : Improper use/position of tools/equipment/materials/products | 3 | 4 | 4 | 1 | 1 | 2 | 1 | 0 | 3 | 2 | 21 |
| PEOPLE (ACTS) : Inattention/Lack of Awareness : Lack of attention/distracted by other concerns/stress | 6 | 4 | 1 | 4 | 1 | 0 | 2 | 0 | 1 | 0 | 19 |
| PEOPLE (ACTS) : Following Procedures : Deviation intentional (by individual or group) | 2 | 2 | 5 | 1 | 0 | 0 | 1 | 1 | 2 | 1 | 15 |
| PEOPLE (ACTS) : Use of Protective Methods : Inadequate use of safety systems | 1 | 1 | 4 | 1 | 1 | 0 | 0 | 0 | 1 | 5 | 14 |
| PEOPLE (ACTS) : Following Procedures : Work or motion at improper speed | 2 | 4 | 1 | 1 | 0 | 1 | 2 | 1 | 0 | 2 | 14 |
| PROCESS (CONDITIONS) : Organizational : Poor leadership/organizational culture | 0 | 6 | 3 | 0 | 1 | 1 | 0 | 0 | 1 | 1 | 13 |
| PEOPLE (ACTS) : Use of Protective Methods : Personal Protective Equipment not used or used improperly | 1 | 2 | 1 | 2 | 0 | 2 | 1 | 1 | 0 | 3 | 13 |
| PROCESS (CONDITIONS) : Protective Systems : Inadequate/defective warning systems/safety devices | 2 | 1 | 2 | 1 | 0 | 1 | 1 | 1 | 1 | 1 | 11 |
| PROCESS (CONDITIONS) : Organizational : Failure to report/learn from events | 2 | 0 | 2 | 3 | 0 | 1 | 0 | 1 | 0 | 0 | 9 |
| PROCESS (CONDITIONS) : Work Place Hazards : Hazardous atmosphere (explosive/toxic/asphyxiant) | 1 | 1 | 0 | 0 | 0 | 0 | 1 | 1 | 2 | 3 | 9 |
| PROCESS (CONDITIONS) : Work Place Hazards : Congestion, clutter or restricted motion | 1 | 1 | 2 | 0 | 0 | 1 | 3 | 0 | 0 | 1 | 9 |
| PROCESS (CONDITIONS) : Work Place Hazards : Inadequate surfaces, floors, walkways or roads | 3 | 0 | 0 | 0 | 1 | 0 | 0 | 1 | 0 | 3 | 8 |
| PEOPLE (ACTS) : Inattention/Lack of Awareness : Fatigue | 1 | 2 | 0 | 1 | 0 | 1 | 1 | 0 | 1 | 1 | 8 |
| PEOPLE (ACTS) : Use of Protective Methods : Disabled or removed guards, warning systems or safety devices | 1 | 0 | 2 | 0 | 0 | 1 | 0 | 0 | 1 | 2 | 7 |
| PROCESS (CONDITIONS) : Protective Systems : Inadequate/defective Personal Protective Equipment | 0 | 1 | 0 | 2 | 0 | 1 | 0 | 0 | 0 | 1 | 5 |
| PEOPLE (ACTS) : Inattention/Lack of Awareness : Acts of violence | 0 | 2 | 0 | 0 | 0 | 1 | 0 | 0 | 0 | 1 | 4 |
| PROCESS (CONDITIONS) : Work Place Hazards : Storms or acts of nature | 1 | 1 | 1 | 0 | 0 | 0 | 0 | 0 | 0 | 0 | 3 |
| PEOPLE (ACTS) : Following Procedures : Overexertion or improper position/posture for task | 1 | 1 | 1 | 0 | 0 | 0 | 0 | 0 | 0 | 0 | 3 |
| PEOPLE (ACTS) : Inattention/Lack of Awareness : Use of drugs or alcohol | 0 | 1 | 0 | 0 | 0 | 1 | 0 | 0 | 0 | 0 | 2 |
| PROCESS (CONDITIONS) : Protective Systems : Inadequate security provisions or systems | 0 | 1 | 1 | 0 | 0 | 0 | 0 | 0 | 0 | 0 | 2 |
Causal factors are listed in order of frequency for 2023. The top 10 causal factors assigned to fatal incidents for each year are highlighted.
2023: 14 causal factors were equal 4th with 1 assigned incident (17 factors are highlighted)
2022: 5 causal factors were equal 7th with 4 assigned incidents (11 factors are highlighted)
2021: 7 causal factors were equal 8th with 2 assigned incidents (14 factors are highlighted)
2020: 9 causal factors were equal 9th with 1 assigned incident (17 factors are highlighted)
2019: 4 causal factors were equal 9th with 3 assigned incidents (12 factors are highlighted)
2017: 5 causal factors were equal 10th with 4 assigned incidents (14 factors are highlighted)
2016: 4 causal factors were equal 10th with 3 assigned incidents (13 factors are highlighted)
2.13 High potential event causal factors
High potential events are defined as 'an event which could have, under slightly different circumstances, realistically resulted in a fatal incident'. Participating companies are invited to submit a small number of high potential event reports and to select those with the greatest learning value. The data reported here therefore do not represent the total number of events for the participating companies, so care should be taken in interpreting the data presented in this section.
- 127 of the 131 high potential events reported were assigned causal factors (104 of 106 in 2022).
- 398 causal factors were assigned for the 127 high potential events (343 in 2022).
- Between 1 and 13 causal factors were assigned per event (between 1 and 12 in 2022).
| Causal factor group | 2022 | 2023 |
|---|---|---|
| PEOPLE (ACTS) | 235 | 301 |
| PROCESS (CONDITIONS) | 366 | 344 |
The causal factors assigned to high potential events are shown in Table 23. The highlighted content indicates the top ten causal factors assigned to high potential events in 2023 compared with the previous 9 years. 5 of the causal factors were in the top ten for the 10 years shown.
Additional information on the high potential events reported by region can be found at https://data.iogp.org/Safety/HighPotentialEvents. The information provided includes a narrative description of the incident, the corrective actions and recommendations, and the causal factors assigned by the reporting company.
| Causal factor | 2014 | 2015 | 2016 | 2017 | 2018 | 2019 | 2020 | 2021 | 2022 | 2023 | Total |
|---|---|---|---|---|---|---|---|---|---|---|---|
| PROCESS (CONDITIONS) : Organizational : Inadequate hazard identification or risk assessment | 116 | 54 | 48 | 60 | 29 | 35 | 43 | 44 | 72 | 95 | 596 |
| PROCESS (CONDITIONS) : Organizational : Inadequate work standards/procedures | 80 | 49 | 36 | 38 | 26 | 31 | 37 | 41 | 61 | 41 | 440 |
| PROCESS (CONDITIONS) : Tools, Equipment, Materials and Products : Inadequate design/specification/management of change | 68 | 40 | 33 | 24 | 14 | 38 | 24 | 26 | 29 | 30 | 326 |
| PEOPLE (ACTS) : Inattention/Lack of Awareness : Improper decision making or lack of judgment | 81 | 36 | 29 | 38 | 14 | 20 | 17 | 25 | 16 | 24 | 300 |
| PROCESS (CONDITIONS) : Tools, Equipment, Materials and Products : Inadequate maintenance/inspection/testing | 54 | 28 | 27 | 23 | 25 | 31 | 22 | 23 | 34 | 31 | 298 |
| PROCESS (CONDITIONS) : Organizational : Inadequate training/competence | 47 | 30 | 33 | 29 | 23 | 18 | 14 | 29 | 30 | 33 | 286 |
| PEOPLE (ACTS) : Following Procedures : Improper position (in the line of fire) | 35 | 8 | 14 | 10 | 7 | 6 | 6 | 15 | 79 | 102 | 282 |
| PROCESS (CONDITIONS) : Organizational : Inadequate supervision | 44 | 26 | 28 | 29 | 16 | 17 | 21 | 16 | 34 | 19 | 250 |
| PEOPLE (ACTS) : Use of Tools, Equipment, Materials and Products : Improper use/position of tools/equipment/materials/products | 58 | 23 | 20 | 22 | 18 | 19 | 15 | 10 | 29 | 20 | 234 |
| PROCESS (CONDITIONS) : Tools, Equipment, Materials and Products : Inadequate/defective tools/equipment/materials/products | 57 | 21 | 20 | 29 | 15 | 23 | 11 | 16 | 19 | 12 | 223 |
| PROCESS (CONDITIONS) : Organizational : Inadequate communication | 39 | 22 | 15 | 30 | 18 | 15 | 17 | 17 | 23 | 22 | 218 |
| PEOPLE (ACTS) : Following Procedures : Deviation unintentional (by individual or group) | 58 | 18 | 16 | 21 | 15 | 11 | 14 | 23 | 23 | 14 | 213 |
| PEOPLE (ACTS) : Use of Protective Methods : Equipment or materials not secured | 62 | 13 | 10 | 13 | 11 | 5 | 11 | 12 | 10 | 36 | 183 |
| PROCESS (CONDITIONS) : Protective Systems : Inadequate/defective guards or protective barriers | 51 | 14 | 16 | 22 | 10 | 12 | 9 | 6 | 23 | 15 | 178 |
| PEOPLE (ACTS) : Inattention/Lack of Awareness : Lack of attention/distracted by other concerns/stress | 48 | 21 | 16 | 8 | 7 | 9 | 9 | 10 | 7 | 12 | 147 |
| PEOPLE (ACTS) : Use of Protective Methods : Failure to warn of hazard | 40 | 11 | 12 | 7 | 10 | 12 | 11 | 9 | 16 | 18 | 146 |
| PEOPLE (ACTS) : Following Procedures : Improper lifting or loading | 34 | 3 | 5 | 9 | 8 | 11 | 8 | 8 | 17 | 22 | 125 |
| PEOPLE (ACTS) : Use of Protective Methods : Inadequate use of safety systems | 19 | 7 | 15 | 6 | 8 | 5 | 10 | 5 | 6 | 11 | 92 |
| PEOPLE (ACTS) : Use of Tools, Equipment, Materials and Products : Servicing of energized equipment/inadequate energy isolation | 19 | 6 | 10 | 7 | 5 | 5 | 6 | 7 | 8 | 16 | 89 |
| PROCESS (CONDITIONS) : Protective Systems : Inadequate/defective warning systems/safety devices | 17 | 7 | 10 | 13 | 7 | 7 | 6 | 10 | 7 | 4 | 88 |
| PEOPLE (ACTS) : Following Procedures : Deviation intentional (by individual or group) | 24 | 9 | 4 | 12 | 2 | 7 | 2 | 8 | 12 | 6 | 86 |
| PROCESS (CONDITIONS) : Organizational : Poor leadership/organizational culture | 15 | 14 | 13 | 5 | 3 | 3 | 4 | 3 | 12 | 8 | 80 |
| PROCESS (CONDITIONS) : Organizational : Failure to report/learn from events | 13 | 4 | 5 | 6 | 4 | 5 | 3 | 7 | 4 | 6 | 57 |
| PROCESS (CONDITIONS) : Work Place Hazards : Storms or acts of nature | 17 | 1 | 3 | 1 | 2 | 7 | 2 | 7 | 5 | 8 | 53 |
| PROCESS (CONDITIONS) : Work Place Hazards : Hazardous atmosphere (explosive/toxic/asphyxiant) | 17 | 1 | 6 | 4 | 3 | 1 | 2 | 4 | 4 | 6 | 48 |
| PEOPLE (ACTS) : Use of Protective Methods : Personal Protective Equipment not used or used improperly | 9 | 3 | 4 | 5 | 2 | 4 | 3 | 5 | 3 | 6 | 44 |
| PROCESS (CONDITIONS) : Work Place Hazards : Inadequate surfaces, floors, walkways or roads | 15 | 4 | 3 | 0 | 0 | 6 | 1 | 0 | 5 | 9 | 43 |
| PROCESS (CONDITIONS) : Work Place Hazards : Congestion, clutter or restricted motion | 11 | 5 | 4 | 3 | 1 | 1 | 2 | 0 | 3 | 5 | 35 |
| PEOPLE (ACTS) : Use of Protective Methods : Disabled or removed guards, warning systems or safety devices | 9 | 1 | 1 | 5 | 1 | 5 | 3 | 5 | 2 | 3 | 35 |
| PEOPLE (ACTS) : Following Procedures : Work or motion at improper speed | 4 | 3 | 1 | 1 | 2 | 2 | 2 | 3 | 4 | 8 | 30 |
| PEOPLE (ACTS) : Inattention/Lack of Awareness : Fatigue | 5 | 2 | 3 | 3 | 1 | 4 | 2 | 3 | 2 | 3 | 28 |
| PROCESS (CONDITIONS) : Protective Systems : Inadequate security provisions or systems | 4 | 1 | 4 | 0 | 2 | 1 | 4 | 0 | 0 | 0 | 16 |
| PROCESS (CONDITIONS) : Protective Systems : Inadequate/defective Personal Protective Equipment | 2 | 3 | 1 | 3 | 0 | 1 | 1 | 1 | 1 | 0 | 13 |
| PEOPLE (ACTS) : Following Procedures : Overexertion or improper position/posture for task | 1 | 2 | 2 | 1 | 2 | 2 | 1 | 0 | 1 | 0 | 12 |
| PEOPLE (ACTS) : Inattention/Lack of Awareness : Acts of violence | 2 | 0 | 0 | 0 | 0 | 0 | 0 | 0 | 0 | 0 | 2 |
| PEOPLE (ACTS) : Inattention/Lack of Awareness : Use of drugs or alcohol | 1 | 0 | 0 | 0 | 0 | 0 | 0 | 0 | 0 | 0 | 1 |
Causal factors are listed in order of frequency for 2023. The top 10 causal factors assigned to high potential events for each year are highlighted.
2020: 2 causal factors were equal 10th with 14 assigned events (11 factors are highlighted)
2019: 2 causal factors were equal 10th with 22 assigned events (11 factors are highlighted)
2018: 3 causal factors were equal 10th with 16 assigned events (12 factors are highlighted)
2017: 2 causal factors were equal 10th with 21 assigned events (11 factors are highlighted)
2.14 Life-Saving Rules
In 2010, IOGP released IOGP Report 459 - Life-Saving Rules, intended for use by the oil and gas industry to mitigate risk and reduce fatalities. Each IOGP Life-Saving Rule consisted of a simple icon and descriptive text, providing clear, simple, and consistent communication about risks in the workplace.
These Rules were developed by using the fatal incident and high potential event data from the 1991 to 2010 Safety Performance Indicators Reports to identify the events and activities that are the highest risk and therefore provide clear instructions on how to avoid them.
In 2018, IOGP re-examined the applicability of the 2010 Rules against the most recent fatality data. With the 2018 revision of Report 459, IOGP launched a simplified set of Life-Saving Rules (Figure 41) to provide workers in the industry with the actions they can take to protect themselves and their colleagues from fatalities. With a reduced number of rules (9 reduced from 18), but still covering a similar scope, IOGP aims to improve the level of industry-wide adoption across the global oil and gas industry.
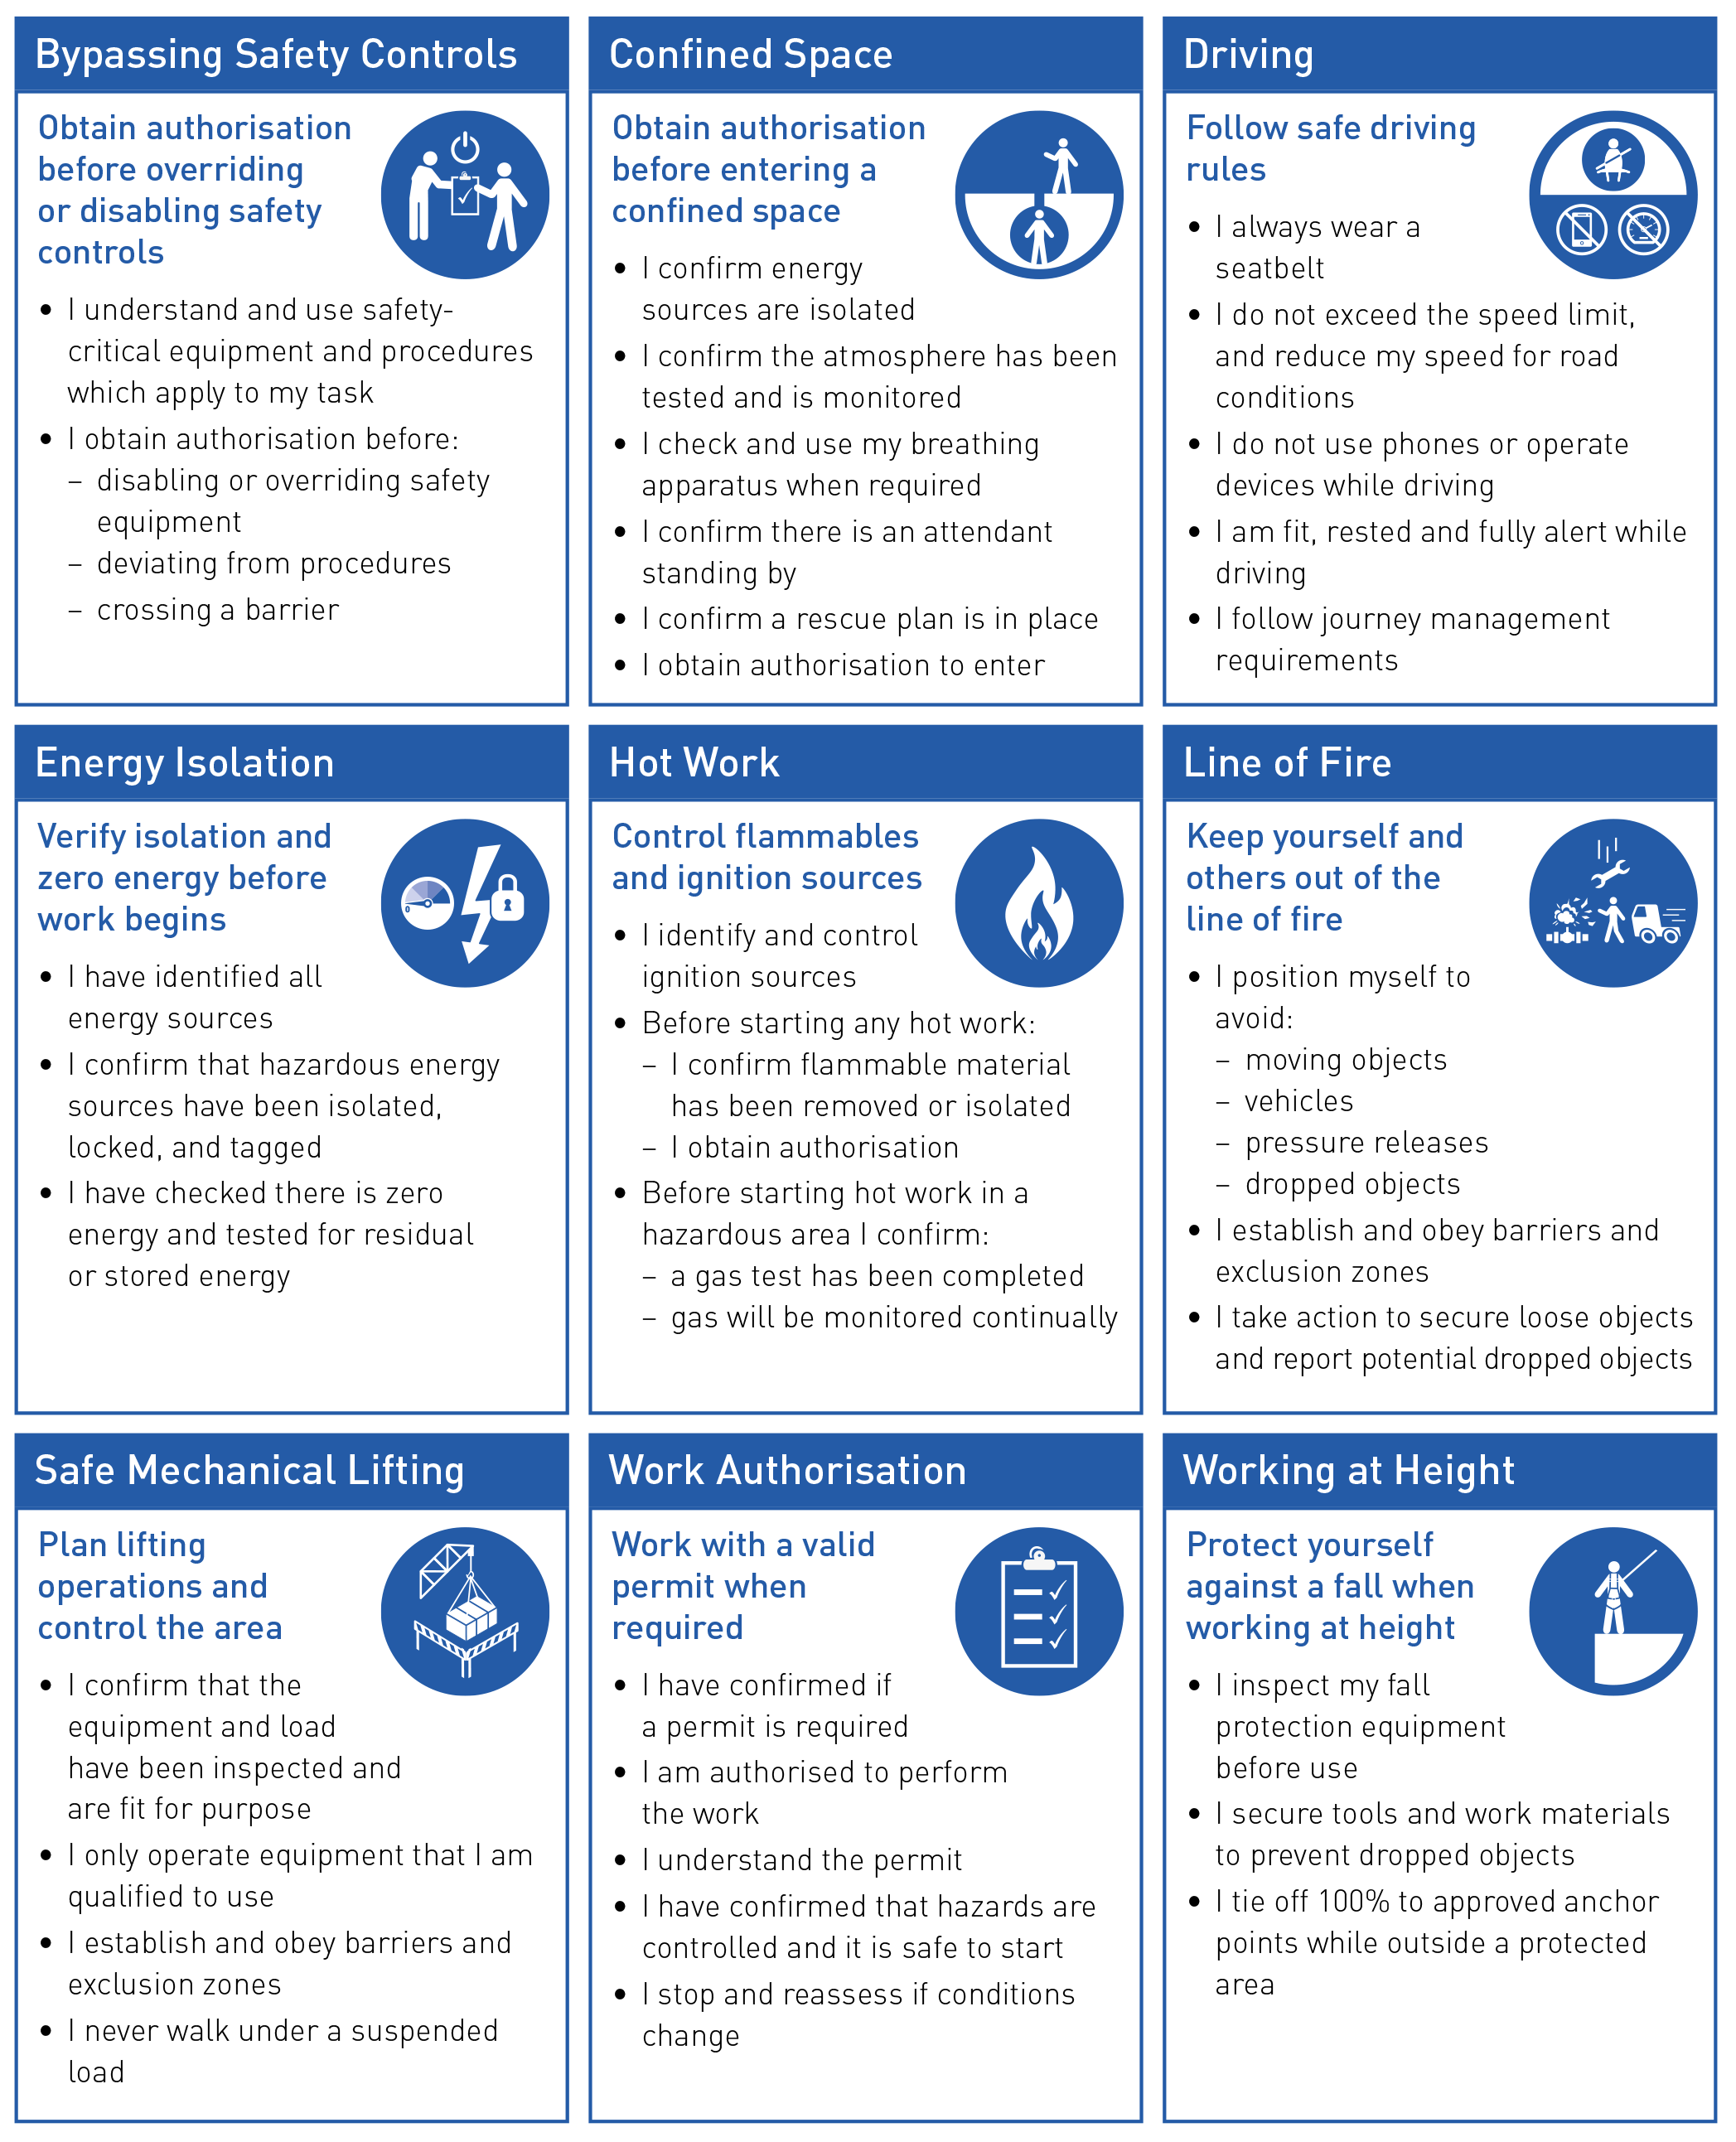
In 2021, IOGP released IOGP Report 459-1 - Life-Saving Rules – Start Work Checks, a set of standardized and simplified checklists of safeguards that workers complete at the job location immediately before work commences. The Start Work Checks are supplemental to the Life-Saving Rules (Report 459).
Assessment of the applicability of the IOGP Life-Saving Rules to fatal incident descriptions for 2023 data has shown that at least 76% of the fatal incidents reported are covered by the IOGP Life-Saving Rules and may have been prevented by the adoption of this system.
Incidents where there was no applicable rule have been excluded from figure 42.
| Life-Saving Rule | Fatal incidents | ||||
|---|---|---|---|---|---|
| 2019 | 2020 | 2021 | 2022 | 2023 | |
| Bypassing safety controls | 0 | 0 | 2 | 1 | 2 |
| Confined space | 0 | 0 | 0 | 2 | 1 |
| Driving | 1 | 2 | 3 | 4 | 3 |
| Energy isolation | 1 | 4 | 1 | 1 | 4 |
| Hot work | 0 | 3 | 0 | 1 | 2 |
| Line of fire | 5 | 12 | 2 | 3 | 12 |
| Safe mechanical lifting | 3 | 2 | 2 | 1 | 6 |
| Work authorization | 0 | 1 | 1 | 3 | 1 |
| Working at height | 4 | 1 | 2 | 2 | 3 |
| Other issue – no applicable rule | 0 | 4 | 4 | 3 | 5 |
| Unspecified | 1 | 0 | 0 | 0 | 1 |
Incidents where there was no applicable rule have been excluded from figure 44.
| Life-Saving Rule | Lost work day cases | ||||
|---|---|---|---|---|---|
| 2019 | 2020 | 2021 | 2022 | 2023 | |
| Bypassing safety controls | 5 | 5 | 23 | 25 | 13 |
| Confined space | 2 | 7 | 2 | 7 | 6 |
| Driving | 7 | 13 | 16 | 33 | 20 |
| Energy isolation | 20 | 20 | 22 | 22 | 33 |
| Hot work | 7 | 6 | 4 | 5 | 7 |
| Line of fire | 109 | 176 | 210 | 215 | 255 |
| Safe mechanical lifting | 42 | 23 | 47 | 46 | 43 |
| Work authorization | 7 | 17 | 13 | 28 | 24 |
| Working at height | 44 | 37 | 30 | 41 | 42 |
| Other issue – no applicable rule | 200 | 180 | 140 | 186 | 176 |
| Unspecified | 137 | 198 | 241 | 338 | 297 |
See Appendix B - Section 2 for data tables.
3. Results by region
In this section, the safety performance of the contributing IOGP Member Companies is presented for regions and individual countries within those regions.
Indicators used to measure contributing IOGP Member Companies’ safety performance are:
- number of fatalities
- fatal accident rate (FAR)
- total recordable injury rate (TRIR)
- lost time injury rate (LTIR)
- FAR, TRIR, and LTIR five-year rolling averages
- severity of lost work day cases (LWDC)
- individual country performance
- incident triangles by region
- fatalities by incident category and activity
Third party fatalities are not included in this analysis.
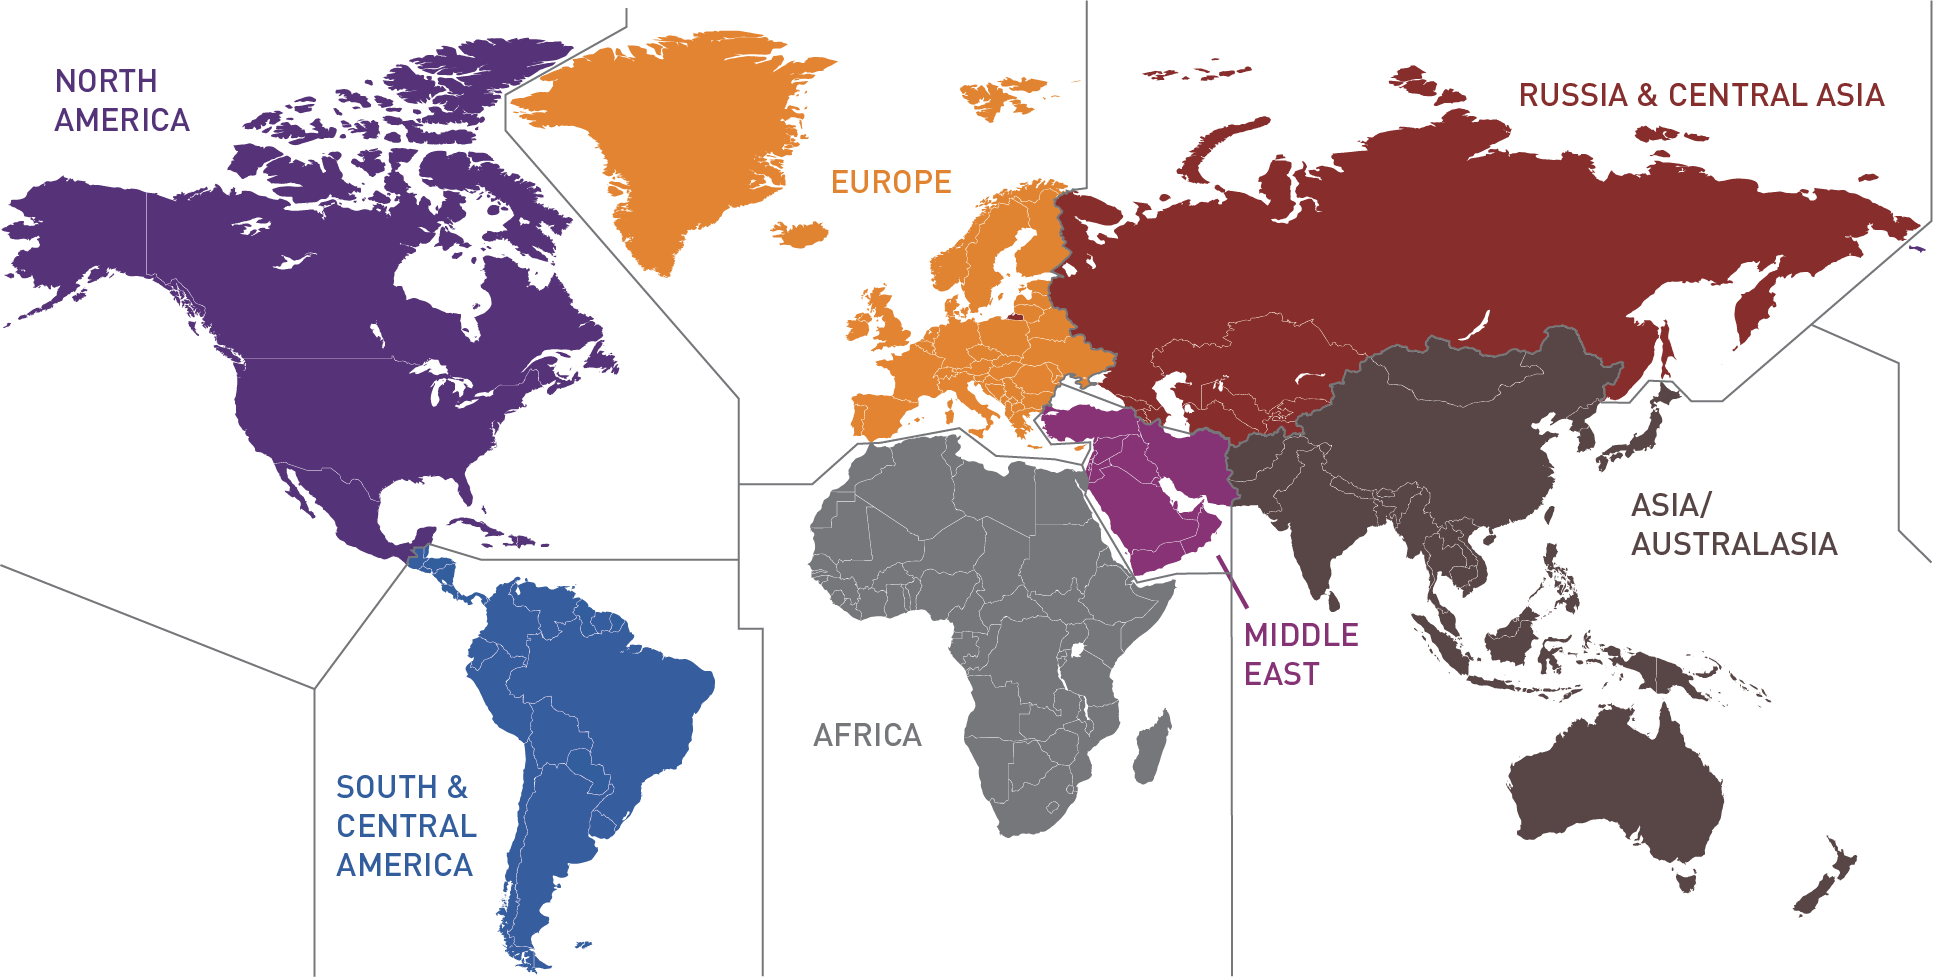
Maps showing the division of countries into regions, and the work hours and number of participating companies by country, are provided in Appendix D.
Countries and companies that are subject to international sanctions (Russia and Iran) are not featured in this Report for 2022 and 2023 data.
Fatal accident rate (FAR):
The number of company/contractor fatalities per 100 million hours worked.
Fatal incidents per 100 million work hours (FIR):
The number of incidents that result in one or more fatalities per 100 million hours worked.
Total recordable injury rate (TRIR)
The number of recordable injuries (fatalities + lost work day cases + restricted work day cases + medical treatment cases (MTC)) per million hours worked. Note when MTC are not reported by a company for a country the associated fatalities, lost work day cases and restricted work day cases are excluded from TRIR calculations.
Lost time injury rate (LTIR)
The number of lost time injuries (fatalities + lost work day cases) per million hours worked.
Five-year rolling average
The five-year rolling average is calculated by summing the total number of incidents for the five previous years and dividing by the sum of the work hours for these years. The number series involved in the calculation is frame shifted along by one each year, e.g., 2023 will be calculated from 2019-2023 data. For example, the five-year rolling average FAR for 2023 is calculated by:
(Total work hours in 2019+2020+2021+2022+2023) / 100,000,000
Lost work day case (LWDC)
An incident resulting in at least one day off work. Fatal incidents are not included.
LWDC Severity
The average number of days lost (where reported) for each lost work day case.
3.1 Fatalities
Table 26 shows the number of atalities, fatal incidents, and fatal accident rate in each of the seven regions into which the data are partitioned.
| Region | Fatalities | Fatal accident rate (FAR) | Fatal incidents | |||
|---|---|---|---|---|---|---|
| 2022 | 2023 | 2022 | 2023 | 2022 | 2023 | |
| Africa | 8 | 8 | 1.67 | 2.04 | 3 | 5 |
| Asia/Australasia | 3 | 18 | 0.34 | 2.29 | 2 | 15 |
| Europe | 1 | 1 | 0.43 | 0.47 | 1 | 1 |
| Middle East | 9 | 8 | 0.77 | 0.65 | 6 | 7 |
| North America | 7 | 5 | 0.93 | 0.78 | 5 | 5 |
| Russia & Central Asia | 2 | 8 | 0.88 | 3.47 | 2 | 5 |
| South & Central America | 2 | 4 | 0.48 | 1.15 | 2 | 2 |
| OVERALL | 32 | 52 | 0.77 | 1.35 | 21 | 40 |
3.2 Fatal accident rate
Further fatal accident rate (FAR) analysis is presented in Section 3.5, where five-year rolling averages of FAR are presented for each of the regions.
| Region | Fatal accident rate (FAR) | ||||
|---|---|---|---|---|---|
| 2019 | 2020 | 2021 | 2022 | 2023 | |
| Africa | 2.16 | 0.54 | 1.29 | 1.67 | 2.04 |
| Asia/Australasia | 0.00 | 1.44 | 1.94 | 0.34 | 2.29 |
| Europe | 0.87 | 0.00 | 0.00 | 0.43 | 0.47 |
| Middle East | 0.60 | 2.17 | 0.40 | 0.77 | 0.65 |
| North America | 0.38 | 1.21 | 0.78 | 0.93 | 0.78 |
| Russia & Central Asia | 0.60 | 0.94 | 1.29 | 0.88 | 3.47 |
| South & Central America | 1.14 | 1.93 | 0.00 | 0.48 | 1.15 |
| OVERALL | 0.75 | 1.28 | 0.82 | 0.77 | 1.35 |
3.3 Total recordable injury rate
Submissions without information on medical treatment cases were filtered out, leaving a database of 3,291 million hours (almost 100% of the database). See Appendix A – Database dimensions.
| Region | Total recordable injury rate (TRIR) | ||||
|---|---|---|---|---|---|
| 2019 | 2020 | 2021 | 2022 | 2023 | |
| Africa | 0.39 | 0.37 | 0.36 | 0.42 | 0.53 |
| Asia/Australasia | 0.69 | 0.77 | 0.66 | 0.53 | 0.59 |
| Europe | 1.93 | 1.82 | 1.67 | 2.06 | 2.21 |
| Middle East | 0.30 | 0.30 | 0.40 | 0.44 | 0.37 |
| North America | 1.40 | 1.61 | 1.70 | 1.62 | 1.41 |
| Russia & Central Asia | 0.46 | 0.60 | 0.52 | 0.67 | 0.72 |
| South & Central America | 1.14 | 1.45 | 1.62 | 1.43 | 1.05 |
| OVERALL | 0.77 | 0.90 | 0.84 | 0.81 | 0.75 |
3.4 Lost time injury rate
Further analysis of the lost time injuries is presented in Section 3.5, where five-year rolling averages of lost time injury rate (LTIR) are presented for each of the regions.
| Region | Lost time injury rate (LTIR) | ||||
|---|---|---|---|---|---|
| 2019 | 2020 | 2021 | 2022 | 2023 | |
| Africa | 0.13 | 0.11 | 0.10 | 0.16 | 0.19 |
| Asia/Australasia | 0.14 | 0.16 | 0.14 | 0.12 | 0.12 |
| Europe | 0.82 | 0.77 | 0.68 | 0.91 | 1.02 |
| Middle East | 0.06 | 0.09 | 0.10 | 0.11 | 0.12 |
| North America | 0.23 | 0.33 | 0.35 | 0.28 | 0.26 |
| Russia & Central Asia | 0.15 | 0.16 | 0.17 | 0.24 | 0.35 |
| South & Central America | 0.42 | 0.63 | 0.52 | 0.46 | 0.52 |
| OVERALL | 0.22 | 0.28 | 0.24 | 0.24 | 0.25 |
3.5 FAR, TRIR, and LTIR five-year rolling averages
In order to smooth out variability in the annual values for the regional FAR, TRIR, and LTIR, five-year rolling averages are computed, which should provide a more reliable indicator of performance trends.
The figures show FAR, TRIR, and LTIR 5-year rolling averages for each of the regions and includes the ‘overall’ curve.
3.6 Severity of LWDC
The number of days lost was reported for 81% of lost work day cases.
The severity of lost work day cases is the highest in the Russia & Central Asia region (70 days lost per LWDC in 2023). This is virtually unchanged compared with the average for the previous five-year period.
Data table 4 in Appendix A provides further information on the proportion of the database that can be used for LWDC severity. 99% of the data submitted for Africa and 99% of the data submitted for the Middle East were usable for this metric, in comparison with only 51% of equivalent data for North America, and 64% for Europe. At least 93% of the data submitted for all other regions were usable for this metric.
| Region | Severity of LWDC (average days lost per LWDC) | 2023 relative to 2018-2022 | 2023 relative to 2022 | ||
|---|---|---|---|---|---|
| 2018-2022 | 2022 | 2023 | |||
| Africa | 38.0 | 40.1 | 21.7 | 43% lower | 46% lower |
| Asia/Australasia | 41.9 | 37.4 | 50.3 | 20% higher | 35% higher |
| Europe | 40.9 | 43.9 | 49.0 | 20% higher | 12% higher |
| Middle East | 29.4 | 22.9 | 26.5 | 10% lower | 16% higher |
| North America | 55.3 | 59.7 | 56.7 | 3% higher | 5% lower |
| Russia & Central Asia | 64.4 | 52.8 | 64.2 | 0.3% lower | 22% higher |
| South & Central America | 51.7 | 54.6 | 33.8 | 35% lower | 38% lower |
| OVERALL | 46.4 | 45.3 | 42.3 | 9% lower | 7% lower |
3.7 Individual country performance
The safety performance reported by participating IOGP Member Companies in individual countries is presented in terms of the lost time injury rate of companies jointly with contractors. To preserve the anonymity of companies, performance is only published for those countries for which at least 2 companies have reported statistics. Countries with less than 50,000 reported work hours are excluded, since results for such small populations of hours would be unrepresentative. Overall averages and regional averages include data from all countries regardless of work hours or number of contributing companies.
25 of the 92 countries for which data have been reported are excluded by these constraints.
TRIR calculations exclude data where medical treatment cases are not reported. The chart of relative TRIR performance therefore compares the 2023 performance with that of 2022 and 2021 for all of the 67 countries.
The majority of countries in Africa, Asia/Australasia, Russia & Central Asia, the Middle East, and South & Central America achieved a TRIR equal to or lower than the overall average TRIR (0.84). The majority of countries in Europe and North America show a TRIR higher than the global average.
The chart of relative LTIR performance for the 67 countries compares the 2023 performance with that of 2022 and 2021.
The majority of countries in Africa, Asia/Australasia, Russia & Central Asia, and the Middle East achieved a LTIR equal to or lower than the overall average LTIR (0.24). The majority of countries in Europe, North America, and South & Central America show a LTIR higher than the global average.
For comparison, the 5-year rolling average FAR is shown for each of the regions. There appears to be little if any correlation between these values and the regional average LTIR and TRIR values.
3.8 Incident triangles by region
In this section, the relative numbers of types of occupational injury are shown in the form of ‘incident triangles’. The ratios have been corrected to account for the absence, in some data submissions, of medical treatment cases.
Lost time injuries (LTI):
Lost work day cases and fatalities.
Total recordable injuries (TRI):
Fatalities, lost work day cases, restricted work day cases, and medical treatment cases where medical treatment cases are reported for the data set.
Ratio of LTI to fatalities:
The number of LTI divided by the total number of fatalities (LTI/fatalities).
Ratio of TRI to fatalities:
The number of TRI divided by the total number of fatalities (Lost time injury rate/fatalities). Note: data are excluded from TRI where medical treatment cases are not reported.
| Year | Ratio of LTI to fatalities | Ratio of TRI to fatalities |
|---|---|---|
| 2025 | 9:1 | 26:1 |
| 2024 | 9:1 | 95:1 |
| 2023 | 8:1 | 28:1 |
| 2022 | 21:1 | 69:1 |
Figure 55:
Incident triangles (2023) - Africa
| Year | Ratio of LTI to fatalities | Ratio of TRI injuries to fatalities |
|---|---|---|
| 2025 | 5:1 | 26:1 |
| 2024 | 34:1 | 154:1 |
| 2023 | 7:1 | 34:1 |
| 2022 | 11:1 | 54:1 |
Figure 56:
Incident triangles (2023) - Asia/Australasia
| Year | Ratio of LTI to fatalities | Ratio of TRI injuries to fatalities |
|---|---|---|
| 2025 | 220:1 | 476:1 |
| 2024 | 210:1 | 466:1 |
| 2023 | N/A | N/A |
| 2022 | N/A | N/A |
Figure 57:
Incident triangles (2023) - Europe
| Year | Ratio of LTI to fatalities | Ratio of TRI to fatalities |
|---|---|---|
| 2025 | 18:1 | 57:1 |
| 2024 | 15:1 | 57:1 |
| 2023 | 25:1 | 102:1 |
| 2022 | 4:1 | 14:1 |
Figure 58:
Incident triangles (2023) - Middle East
| Year | Ratio of LTI to fatalities | Ratio of TRI to fatalities |
|---|---|---|
| 2025 | 34:1 | 201:1 |
| 2024 | 31:1 | 232:1 |
| 2023 | 45:1 | 218:1 |
| 2022 | 28:1 | 133:1 |
Figure 59:
Incident triangles (2023) - North America
| Year | Ratio of LTI to fatalities | Ratio of TRI to fatalities |
|---|---|---|
| 2025 | 10:1 | 21:1 |
| 2024 | 27:1 | 77:1 |
| 2023 | 14:1 | 40:1 |
| 2022 | 17:1 | 55:1 |
Figure 60:
Incident triangles (2023) - Russia & Central Asia
| Year | Ratio of LTI to fatalities | Ratio of TRI to fatalities |
|---|---|---|
| 2025 | 46:1 | 92:1 |
| 2024 | 96:1 | 293:1 |
| 2023 | N/A | N/A |
| 2022 | 33:1 | 75:1 |
Figure 61:
Incident triangles (2023) - South America
See Appendix B - Section 3 for data tables.
4. Results by function
In this section, safety performance within different functions performed in the E&P industry is presented for 2023. Functions are defined as ‘exploration’, ‘drilling’, ‘production’, ‘construction’, and ‘unspecified’.
See the Glossary of Terms for definitions.
The percentage of the total work hours reported under each function has been detailed below. See Appendix B for further data.
| Function | Percentage of total work hours | ||||
|---|---|---|---|---|---|
| 2019 | 2020 | 2021 | 2022 | 2023 | |
| Exploration | 1.4 | 1.1 | 1.3 | 1.3 | 2.0 |
| Drilling | 12.3 | 12.7 | 15.0 | 17.2 | 13.7 |
| Production | 49.5 | 49.1 | 45.6 | 44.4 | 45.2 |
| Construction | 20.9 | 17.9 | 18.4 | 19.3 | 19.4 |
| Unspecified | 15.9 | 19.2 | 19.7 | 17.7 | 19.8 |
| Function | Work hours (thousands) | ||||
|---|---|---|---|---|---|
| 2019 | 2020 | 2021 | 2022 | 2023 | |
| OVERALL | 2,679,026 | 2,579,000 | 3,291,382 | 4,158,877 | 3,852,334 |
Fatal accident rate (FAR):
The number of company/contractor fatalities per 100 million hours worked.
Fatal incidents per 100 million work hours (FIR):
The number of incidents that result in one or more fatalities per 100 million hours worked.
Total recordable injury rate (TRIR)
The number of recordable injuries (fatalities + lost work day cases + restricted work day cases + medical treatment cases (MTC)) per million hours worked. Note when MTC are not reported by a company for a country the associated fatalities, lost work day cases and restricted work day cases are excluded from TRIR calculations.
Lost time injury rate (LTIR)
The number of lost time injuries (fatalities + lost work day cases) per million hours worked.
Five-year rolling average
The five-year rolling average is calculated by summing the total number of incidents for the five previous years and dividing by the sum of the work hours for these years. The number series involved in the calculation is frame shifted along by one each year, e.g., 2023 will be calculated from 2019-2023 data. For example, the five-year rolling average FAR for 2023 is calculated by:
(Total work hours in 2019+2020+2021+2022+2023) / 100,000,000
Lost work day case (LWDC)
An incident resulting in at least one day off work. Fatal incidents are not included.
LWDC Severity
The average number of days lost (where reported) for each lost work day case.
4.1 Fatalities
The distribution of company and contractor fatal incidents and fatalities between the functions is shown for the years 2019-2023.
| Function | Fatal incidents | Fatalities | ||||||||
|---|---|---|---|---|---|---|---|---|---|---|
| 2019 | 2020 | 2021 | 2022 | 2023 | 2019 | 2020 | 2021 | 2022 | 2023 | |
| Exploration | 0 | 1 | 0 | 0 | 0 | 0 | 1 | 0 | 0 | 0 |
| Drilling | 7 | 7 | 2 | 6 | 8 | 7 | 8 | 2 | 6 | 9 |
| Production | 5 | 11 | 10 | 13 | 20 | 5 | 13 | 13 | 19 | 31 |
| Construction | 3 | 4 | 2 | 1 | 4 | 8 | 4 | 4 | 1 | 4 |
| Unspecified | 0 | 6 | 3 | 1 | 8 | 0 | 7 | 8 | 6 | 8 |
| OVERALL | 15 | 29 | 17 | 21 | 40 | 20 | 33 | 27 | 32 | 52 |
4.2 FAR, TRIR, and LTIR five-year rolling averages
In order to smooth out variability in the annual values for TRIR, FAR, and LTIR by function, five-year rolling averages are computed which should provide a more reliable indicator of performance trends.
For calculations of TRIR submissions without information on medical treatment cases were removed, leaving a database of 3,291 million hours, almost 100% of the database. See Appendix A for more details.
4.3 Severity of LWDC
The overall average number of days lost per lost work day case (LWDC) is 50.0 in 2023 (41.3 in 2022).
Offshore, the LWDC severity is 56.1 days lost per LWDC compared with 46.2 days for onshore activities (34.9 and 45.4 respectively for 2022).
See Section 2.8 for additional information and Section 3.6 for LWDC severity by region.
4.4 Exploration performance
Total recordable injury rate – exploration
Figures 66 and 67 show the total recordable injury rate (TRIR) for companies and contractors for exploration related activities in different regions of the world. The 2023 result is compared with average TRIR results in the previous five-year period.
43 million work hours (100% of reported exploration work hours) were used in this analysis, of which company activities represent 38% and contractor activities represent 62%. This represents an increase of 14 million work hours compared with 2022 (29 million work hours in 2022: 41% company, 59% contractor).
In 2023, the overall TRIR values for companies and contractors engaged in exploration activities are 0.12 and 0.68 respectively; the overall average TRIR for exploration activities is 0.47.
Further information on exploration TRIR by region is available in Appendix B - Table B35.
Exploration
Geophysical, seismographic, and geological operations, including their administrative and engineering aspects, construction, maintenance, materials supply and transportation of personnel and equipment (excluding drilling).
Lost time injury rate – exploration
Figures 68 and 69 show the lost time injury rate (LTIR) for companies and contractors for exploration related activities in different regions of the world. The 2023 result is compared with average LTIR results in the previous five-year period.
43 million work hours (100% of reported exploration work hours) were used in this analysis, of which company activities represent 38% and contractor activities represent 62% (41% company, 59% contractor in 2022). This represents an increase of 14 million work hours compared with 2022.
In 2023, the overall LTIR values for companies and contractors engaged in exploration activities are 0.06 and 0.30 respectively; the overall average LTIR for exploration activities is 0.21.
Further information on exploration LTIR by region is available in Appendix B - Table B36.
4.5 Drilling performance
Total recordable injury rate – drilling
Figures 70 and 71 show the total recordable injury rate (TRIR) for companies and contractors for drilling related activities in different regions of the world. The 2023 result is compared with average TRIR results in the previous five-year period.
494 million work hours (100% of reported drilling work hours) were used in this analysis, of which company activities represent 14% and contractor activities represent 86%. This represents an increase of 167 million work hours compared with 2022 (326 million work hours in 2022: 13% company, 87% contractor).
In 2023, the overall TRIR values for companies and contractors engaged in drilling activities are 0.41 and 1.44 respectively; the overall average TRIR for drilling activities is 1.29.
Further information on drilling TRIR by region is available in Appendix B - Table B.37.
Drilling
All exploration, appraisal and production drilling, and workover as well as their administrative, engineering, construction, materials supply and transportation aspects. It includes site preparation, rigging up and down, and restoration of the drilling site upon work completion. Drilling includes all exploration, appraisal and production drilling.
Lost time injury rate – drilling
Figures 72 and 73 show the lost time injury rate (LTIR) for companies and contractors for drilling related activities in different regions of the world. The 2023 result is compared with average LTIR results in the previous five-year period.
494 million work hours (100% of reported drilling work hours) were used in this analysis, of which company activities represent 14% and contractor activities represent 86% (13% company, 87% contractor in 2022). This represents an increase of 167 million work hours compared with 2022.
In 2023, the overall LTIR values for companies and contractors engaged in drilling activities are 0.14 and 0.33 respectively; the overall average LTIR for drilling activities is 0.30.
Further information on drilling LTIR by region is available in Appendix B - Table B.38.
4.6 Production performance
Total recordable injury rate – production
Figures 74 and 75 show the total recordable injury rate (TRIR) for companies and contractors for production related activities, in different regions of the world. The 2023 result is compared with average TRIR results in the previous five-year period.
1,500 million work hours (100% of reported production work hours) were used in this analysis, of which company activities represent 30% and contractor activities represent 70%. This represents an increase of 277 million work hours compared with 2022 (1,223 million work hours in 2022: 27% company, 73% contractor).
In 2023, the overall TRIR values for companies and contractors engaged in production activities are 0.72 and 0.86 respectively; the overall average TRIR for production activities is 0.82.
Further information on production TRIR by region is available in Appendix B - Table B39.
Production
Petroleum and natural gas producing operations, including their administrative and engineering aspects, minor construction, repairs, maintenance and servicing, materials supply, and transportation of personnel and equipment. It covers all mainstream production operations including wireline. It does not cover production drilling and workover. See Appendix E - Glossary for details.
Lost time injury rate – production
Figures 76 and 77 show the lost time injury rate (LTIR) for companies and contractors for production related activities, in different regions of the world. The 2023 result is compared with average LTIR results in the previous five-year period.
1,500 million work hours (100% of reported production work hours) were used in this analysis, of which company activities represent 30% and contractor activities represent 70% (30% company, 70% contractor in 2022). This represents an increase of 233 million work hours compared with 2022.
In 2023, the overall LTIR values for companies and contractors engaged in production activities are 0.30 and 0.26 respectively; the overall average LTIR for production activities is 0.27.
Further information on production LTIR by region is available in Appendix B - Table B40.
4.7 Construction performance
The company and contractor results for 2023 construction performance are presented below.
Construction activities are predominately conducted by contractors therefore the work hours reported for contractors are much greater than those reported for company employees. Refer to Appendix B for detailed information.
Total recordable injury rate – construction
Figures 78 and 79 show the total recordable injury rate (TRIR) for companies and contractors for construction related activities in different regions of the world. The 2023 result is compared with average TRIR results in the previous five-year period.
605 million work hours (100% of reported construction work hours) were used in this analysis, of which company activities represent 10% and contractor activities represent 90%. This represents an increase of 144 million work hours compared with 2022 (461 million work hours in 2022: 9% company, 91% contractor).
In 2023, the overall TRIR values for companies and contractors engaged in construction activities are 0.47 and 0.78 respectively; the overall average TRIR for construction activities is 0.75.
Further information on construction TRIR by region is available in Appendix B - Table B41.
Construction
All major construction, fabrication activities and also disassembly, removal and disposal (decommissioning) at the end of the facility life. Includes construction of process plant, yard construction of structures, offshore installation, hook-up and commissioning, and removal of redundant process facilities.
Lost time injury rate – construction
Figures 80 and 81 show the lost time injury rate (LTIR) for companies and contractors for construction related activities in different regions of the world. The 2023 result is compared with average LTIR results in the previous five-year period.
605 million work hours (100% of reported construction work hours) were used in this analysis, of which company activities represent 10% and contractor activities represent 90% (9% company, 91% contractor in 2022). This represents an increase of 144 million work hours compared with 2022.
In 2023, the overall LTIR values for companies and contractors engaged in construction activities are 0.22 and 0.14 respectively; the overall average LTIR for construction activities is 0.15.
Further information on construction LTIR by region is available in Appendix B - Table B42.
4.8 Unspecified performance
Total recordable injury rate – unspecified
Figures 82 and 83 show the total recordable injury rate (TRIR) for companies and contractors for activities categorized as 'unspecified' in different regions of the world. The 2023 result is compared with average TRIR results in the previous five-year period.
650 million work hours (100% of reported unspecified work hours) were used in this analysis, of which company activities represent 43% and contractor activities represent 57%. This represents an increase of 155 million work hours compared with 2022 (495 million work hours in 2022: 38% company, 62% contractor).
In 2023, the overall TRIR values for companies and contractors engaged in activities where the work function was not specified are 0.43 and 0.84 respectively; the overall average TRIR for unspecified activities is 0.66.
Further information on unspecified TRIR by region is available in Appendix B - Table B43.
Unspecified
Unspecified is used for the entry of data associated with office personnel whose work hours and incident data cannot be reasonably assigned to the administrative support of one of the function groupings of exploration, drilling, production, or construction. Corporate overhead support personnel, such as finance or human resources staff, may be examples where work hours cannot be specifically assigned to a particular function. All other data that are not separated out by function are reported as ‘unspecified’.
Note: Data for companies that did not split their data submission by work function are included in the ‘unspecified’ function.
Lost time injury rate – unspecified
Figures 84 and 85 show the lost time injury rate (LTIR) for companies and contractors for activities categorized as 'unspecified' in different regions of the world. The 2023 result is compared with average LTIR results in the previous five-year period.
650 million work hours (100% of reported unspecified work hours) were used in this analysis, of which company activities represent 43% and contractor activities represent 57% (38% company, 62% contractor in 2022). This represents an increase of 155 million work hours compared with 2022.
In 2023, the overall LTIR values for companies and contractors engaged in activities where the work function was not specified are 0.11 and 0.23 respectively; the overall average LTIR for unspecified activities is 0.18.
Reported under the ‘unspecified’ function in 2023 were:
- 0 company and 8 contractor fatalities
- 32 company and 78 contractor lost work day cases
Reported under the ‘unspecified’ function from 2018 to 2022 were:
- 4 company and 13 contractor fatalities
- 95 company and 244 contractor lost work day cases
Further information on unspecified LTIR by region is available in Appendix B - Table B44.
See Appendix B - Section 4 for data tables.
5. Results by Company
5.1 Overall company results
This section compares the safety performance of individual companies with each other and with their performance in previous years.
For reasons of anonymity each of the companies that has contributed relevant data and is to be included in this analysis has been allocated a unique code letter (A to ZZ). These codes change every year in line with LTIR performance. 4 companies were excluded from this analysis because they did not report contractor data. Results for 54 of the 58 participating companies are therefore shown in this section. In 2023, IOGP Member Companies reported 21 contractor and 6 company employee fatalities.
Fatal accident rate (FAR)
The number of company/contractor fatalities per 100 million hours worked.
Total recordable injury rate (TRIR)
The number of recordable injuries (fatalities + lost work day cases + restricted work day cases + medical treatment cases) per million hours worked.
Lost time injury rate (LTIR)
The number of lost time injuries (fatalities + lost work day cases) per million hours worked.
5.1.1 Fatal accident rate
In Figure 86, the fatal accident rate (FAR) is presented for those companies that, with their contractors, reported more than 50 million work hours. 19 companies met this criterion in 2023, compared with 13 companies in 2022. Companies are presented in rank order of company-with-contractor FAR. The analysis shows that:
- 11 of the 19 companies with their contractors had a lower FAR than the average for companies with contractors reporting more than 50 million work hours (0.62).
- 9 of the 19 companies suffered one or more fatalities.
- 10 of the 19 companies reported no fatalities.
5.1.2 Total recordable injury rate
The total recordable injury rate (TRIR) for companies together with their contractors is presented below. Data are only included where medical treatment cases (MTC) are reported. All 54 companies that reported both company and contractor data qualified for inclusion in this section. Details of results are tabulated in Appendix B.
In 13 instances, contractors achieved a lower TRIR than the companies they were employed by.
Figure 87 shows the TRIR for companies alone, plotted alongside the TRIR for company and contractors jointly, in rank order of the company-with-contractor TRIR.
In Figure 88, the TRIR for contractors alone is plotted alongside the TRIR for company and contractors jointly, in rank order of the company-with-contractor TRIR.
In figure 89, the TRIR is presented for those companies that, with their contractors, reported more than 50 million work hours, in rank order of the company-with-contractor TRIR. 19 companies met this criterion in 2023, compared with 13 in 2022.
8 of the 19 companies with their contractors had a lower TRIR than the overall average for companies with their contractors reporting more than 50 million work hours (0.82).
The remaining 35 companies which, with their contractors, reported less than 50 million work hours are presented below, in rank order of the company-with-contractor TRIR, for companies alone and contractors alone vs. company-with-contractor TRIR.
15 of the 35 companies with their contractors had a lower TRIR than the overall average for smaller companies with contractors (1.02).
5.1.3 Lost time injury rate
The lost time injury rate (LTIR) for companies together with their contractors is presented below. The incidence of a fatality in either company or contractor operations is indicated (*).
54 of the 58 participating companies (A to ZZ) contributed both company and contractor data, although not always for every country in which operations were conducted. Data for all 54 companies that submitted both company and contractor data are therefore included in this section. Detailed results are tabulated in Appendix B. The analysis shows that:
- 49 of the 54 companies with their contractors delivered a LTIR of less than 1.
- 11 of the companies presented below suffered one or more fatality.
- In 15 instances, contractors achieved a lower LTIR than the companies they were employed by.
- 8 companies reported an LTIR of zero for company and contractors combined.
Figure 91 shows the lost time injury rate (LTIR) for companies alone, plotted alongside the LTIR for company and contractors jointly, in rank order of the company-with-contractor LTIR.
In Figure 92, the LTIR for contractors alone is plotted alongside the LTIR for company and contractors jointly, in rank order of the company-with-contractor LTIR.
In Figure 93, the LTIR is presented for those companies that, with their contractors, reported more than 50 million work hours, in rank order of the company-with-contractor LTIR. 19 companies met this criterion in 2023, compared with 13 in 2022. The analysis shows that:
- 12 of the 19 companies with their contractors had a lower LTIR than the overall average for companies with their contractors reporting more than 50 million work hours (0.21).
- 9 of the 19 companies suffered one or more fatalities.
The remaining 35 companies which, with their contractors, reported less than 50 million work hours are presented below, in rank order of the company-with-contractor LTIR.
- 21 of the 35 companies with their contractors had a lower LTIR than the overall average for smaller companies with contractors (0.39).
- 2 of the 35 smaller companies presented below suffered one or more fatalities.
5.2 Company results by function
Results of companies, together with their contractors, have been analysed by function to allow more in-depth benchmarking between companies. The TRIR indicator has been selected, and the ranked results are shown in the following charts. Only companies that provided data by function are included, and then only those companies that reported more than 100,000 hours worked. Results against smaller numbers of hours would not have statistical significance. The company code letters are the same as used elsewhere in this section.
TRIR results by function can be found in Appendix B - Table 46.
See Appendix B - Section 5 for data tables.
Appendix A - Database dimensions
| Type | Work hours reported (thousands) | ||
|---|---|---|---|
| Onshore | Offshore | Overall | |
| Company | 684,185 | 218,756 | 902,941 |
| Contractor | 2,218,787 | 730,605 | 2,949,393 |
| OVERALL | 2,902,972 | 949,362 | 3,852,334 |
The database for the year 2023 covers 3,291,382,000 work hours reported in the upstream sector of the oil and gas industry. The database is 27% bigger than it was in 2022.
- 74% of the hours reported were associated with onshore activities, 26% with offshore activities.
- 92 countries are represented in the database, the same number as in the 2022 database. Countries are listed in the 'Countries' section.
- 58 companies contributed data, of which 54 companies contributed contractor statistics, though not in every case for each country of operation.
- Of the 58 companies, 49 had contributed data in 2022 which accounted for 99% of the database in 2022 and 83% of the database in 2023. 45 of the companies submitting 2023 data had also provided data in 2021.
- 15 of the companies contributed 76% of the hours. 5 companies covered 38% of the hours, and the largest contributor accounted for 12%.
- 27% of the reported work hours were related to company personnel and 73% were related to contractors.
A summary of the key elements of the database is shown in the table at the end of this section.
‘Unspecified (as a work function)’ is used for the entry of data associated with office personnel whose work hours and incident data cannot be reasonably assigned to the administrative support of one of the function groupings of exploration, drilling, production or construction. Corporate overhead support function personnel such as finance or human resources staff may be examples where work hours cannot be specifically assigned to a particular function. All other data that are not separated out by function are reported as ‘unspecified’.
Proportion of database used in analysis
For calculations of fatal accident rate (FAR, fatal incidents per 100 million work hours), and lost time injury rate (LTIR):
- All hours in the database were used.
For calculations of TRIR:
- Submissions without information on medical treatment cases were filtered out, leaving a database of 3,291 million hours, 100% of the database.
- In 2022, the TRIR database was 2,535 million hours, 98% of the total database.
For calculations of lost work day case severity:
- Submissions without information on days off work were filtered out, leaving a database of 2,912 million hours, 88% of the total database.
- In 2022, this database was 2,064 million hours, 80% of the total database.
For calculations of restricted work day case severity:
- Submissions without information on days assigned to restricted activities were filtered out, leaving a database of 2,521 million hours (77% of the total database), and 398 restricted work day cases.
- In 2022, this database was 1,847 million hours, 72% of the total database.
More detailed information is shown in the data tables below.
| Region | Percentage of reported work hours included in analysis | ||
|---|---|---|---|
| TRIR | LWDC severity | RWDC severity | |
| Africa | 100% | 93% | 70% |
| Asia/Australasia | 100% | 51% | 47% |
| Europe | 100% | 57% | 48% |
| Middle East | 100% | 86% | 85% |
| North America | 67% | 56% | 27% |
| Russia & Central Asia | 100% | 93% | 52% |
| South & Central America | 100% | 93% | 32% |
| Function | Percentage of reported work hours included in analysis | ||
|---|---|---|---|
| TRIR | LWDC severity | RWDC severity | |
| Exploration | 74% | 55% | 43% |
| Drilling | 93% | 59% | 39% |
| Production | 96% | 69% | 47% |
| Construction | 100% | 87% | 78% |
| Unspecified | 88% | 84% | 73% |
| Category | Percentage of reported RWDC included in RWDC severity calculations |
|---|---|
| Overall | 73% |
| Company | 78% |
| Contractor | 72% |
| Onshore | 75% |
| Offshore | 69% |
See Appendix B - Database dimensions for data tables.
Appendix B - Data tables
| Region | Data type | Operations | Hours worked (thousands) | Fatalities | LWDCs (number) | RWDCs (number) | MTCs (number) | FAR | TRIR | LTIR |
|---|---|---|---|---|---|---|---|---|---|---|
| Africa | Company | Onshore | 44,700 | 0 | 3 | 4 | 3 | 0.00 | 0.22 | 0.07 |
| Africa | Company | Offshore | 14,747 | 1 | 2 | 2 | 0 | 6.78 | 0.34 | 0.20 |
| Africa | Contractor | Onshore | 225,843 | 2 | 21 | 11 | 41 | 0.89 | 0.33 | 0.10 |
| Africa | Contractor | Offshore | 106,962 | 5 | 40 | 29 | 43 | 4.67 | 1.09 | 0.42 |
| Africa | SUBTOTAL | SUBTOTAL | 392,253 | 8 | 66 | 46 | 87 | 2.04 | 0.53 | 0.19 |
| Asia/Australasia | Company | Onshore | 143,744 | 1 | 9 | 30 | 14 | 0.70 | 0.38 | 0.07 |
| Asia/Australasia | Company | Offshore | 86,428 | 2 | 6 | 16 | 10 | 2.31 | 0.39 | 0.09 |
| Asia/Australasia | Contractor | Onshore | 406,921 | 12 | 34 | 89 | 89 | 2.95 | 0.55 | 0.11 |
| Asia/Australasia | Contractor | Offshore | 149,124 | 3 | 31 | 61 | 58 | 2.01 | 1.03 | 0.23 |
| Asia/Australasia | SUBTOTAL | SUBTOTAL | 786,218 | 18 | 80 | 196 | 171 | 2.29 | 0.59 | 0.12 |
| Europe | Company | Onshore | 75,382 | 0 | 29 | 6 | 17 | 0.00 | 0.69 | 0.38 |
| Europe | Company | Offshore | 23,159 | 0 | 28 | 7 | 30 | 0.00 | 2.81 | 1.21 |
| Europe | Contractor | Onshore | 43,826 | 0 | 56 | 17 | 26 | 0.00 | 2.26 | 1.28 |
| Europe | Contractor | Offshore | 72,670 | 1 | 106 | 49 | 104 | 1.38 | 3.58 | 1.47 |
| Europe | SUBTOTAL | SUBTOTAL | 215,038 | 1 | 219 | 79 | 177 | 0.47 | 2.21 | 1.02 |
| Middle East | Company | Onshore | 110,151 | 0 | 10 | 6 | 18 | 0.00 | 0.31 | 0.09 |
| Middle East | Company | Offshore | 19,197 | 0 | 1 | 2 | 1 | 0.00 | 0.21 | 0.05 |
| Middle East | Contractor | Onshore | 915,818 | 8 | 102 | 116 | 145 | 0.87 | 0.41 | 0.12 |
| Middle East | Contractor | Offshore | 189,068 | 0 | 23 | 11 | 14 | 0.00 | 0.25 | 0.12 |
| Middle East | SUBTOTAL | SUBTOTAL | 1,234,235 | 8 | 136 | 135 | 178 | 0.65 | 0.37 | 0.12 |
| North America | Company | Onshore | 147,042 | 2 | 35 | 18 | 38 | 1.36 | 0.90 | 0.25 |
| North America | Company | Offshore | 40,457 | 0 | 26 | 0 | 6 | 0.00 | 2.14 | 0.64 |
| North America | Contractor | Onshore | 404,084 | 3 | 89 | 114 | 240 | 0.74 | 1.44 | 0.23 |
| North America | Contractor | Offshore | 52,856 | 0 | 13 | 24 | 36 | 0.00 | 2.12 | 0.25 |
| North America | SUBTOTAL | SUBTOTAL | 644,440 | 5 | 163 | 156 | 320 | 0.78 | 1.41 | 0.26 |
| Russia & Central Asia | Company | Onshore | 115,664 | 1 | 35 | 4 | 48 | 0.86 | 0.76 | 0.31 |
| Russia & Central Asia | Company | Offshore | 18,032 | 1 | 4 | 0 | 4 | 5.55 | 0.50 | 0.28 |
| Russia & Central Asia | Contractor | Onshore | 91,281 | 6 | 31 | 7 | 17 | 6.57 | 0.67 | 0.41 |
| Russia & Central Asia | Contractor | Offshore | 5,894 | 0 | 3 | 1 | 4 | 0.00 | 1.36 | 0.51 |
| Russia & Central Asia | SUBTOTAL | SUBTOTAL | 230,872 | 8 | 73 | 12 | 73 | 3.47 | 0.72 | 0.35 |
| South & Central America | Company | Onshore | 47,500 | 0 | 6 | 0 | 3 | 0.00 | 0.19 | 0.13 |
| South & Central America | Company | Offshore | 16,733 | 0 | 9 | 3 | 3 | 0.00 | 0.90 | 0.54 |
| South & Central America | Contractor | Onshore | 131,011 | 4 | 35 | 8 | 26 | 3.05 | 0.56 | 0.30 |
| South & Central America | Contractor | Offshore | 154,030 | 0 | 129 | 15 | 127 | 0.00 | 1.76 | 0.84 |
| South & Central America | SUBTOTAL | SUBTOTAL | 349,275 | 4 | 179 | 26 | 159 | 1.15 | 1.05 | 0.52 |
| TOTAL | Company | Onshore | 684,185 | 4 | 127 | 68 | 141 | 0.58 | 0.52 | 0.19 |
| TOTAL | Company | Offshore | 218,756 | 4 | 76 | 30 | 54 | 1.83 | 0.80 | 0.37 |
| TOTAL | Contractor | Onshore | 2,218,787 | 35 | 368 | 362 | 584 | 1.58 | 0.63 | 0.18 |
| TOTAL | Contractor | Offshore | 730,605 | 9 | 345 | 190 | 386 | 1.23 | 1.31 | 0.48 |
| GRAND TOTAL | TOTAL | TOTAL | 3,852,334 | 52 | 916 | 650 | 1,165 | 1.35 | 0.75 | 0.25 |
| Operations | Hours worked (thousands) | Fatalities | LWDCs (number) | RWDCs (number) | MTCs (number) | FAR | TRIR | LTIR |
|---|---|---|---|---|---|---|---|---|
| OVERALL | 3,852,334 | 52 | 916 | 650 | 1,165 | 1.35 | 0.75 | 0.25 |
| Company | 902,941 | 8 | 203 | 98 | 195 | 0.89 | 0.58 | 0.23 |
| Contractor | 2,949,393 | 44 | 713 | 552 | 970 | 1.49 | 0.80 | 0.26 |
| Onshore | 2,902,972 | 39 | 495 | 430 | 725 | 1.34 | 0.61 | 0.18 |
| Offshore | 949,362 | 13 | 421 | 220 | 440 | 1.37 | 1.20 | 0.46 |
| Function | Data type | Operations | Hours worked (thousands) | Fatalities | LWDCs (number) | RWDCs (number) | MTCs (number) | FAR | TRIR | LTIR |
|---|---|---|---|---|---|---|---|---|---|---|
| Exploration | Company | Onshore | 15,466 | 0 | 1 | 0 | 4 | 0.00 | 0.37 | 0.06 |
| Exploration | Company | Offshore | 2,773 | 0 | 0 | 0 | 0 | 0.00 | 0.00 | 0.00 |
| Exploration | Contractor | Onshore | 36,577 | 0 | 3 | 1 | 0 | 0.00 | 0.16 | 0.08 |
| Exploration | Contractor | Offshore | 20,396 | 0 | 4 | 1 | 4 | 0.00 | 0.44 | 0.20 |
| Exploration | SUBTOTAL | SUBTOTAL | 75,214 | 0 | 8 | 2 | 8 | 0.00 | 0.31 | 0.11 |
| Drilling | Company | Onshore | 50,955 | 0 | 10 | 4 | 11 | 0.00 | 0.46 | 0.20 |
| Drilling | Company | Offshore | 21,893 | 0 | 6 | 1 | 1 | 0.00 | 0.38 | 0.27 |
| Drilling | Contractor | Onshore | 294,623 | 7 | 67 | 61 | 116 | 2.38 | 0.86 | 0.25 |
| Drilling | Contractor | Offshore | 159,590 | 2 | 65 | 42 | 82 | 1.25 | 1.27 | 0.42 |
| Drilling | SUBTOTAL | SUBTOTAL | 527,062 | 9 | 148 | 108 | 210 | 1.71 | 0.94 | 0.30 |
| Production | Company | Onshore | 332,461 | 2 | 81 | 32 | 93 | 0.60 | 0.66 | 0.25 |
| Production | Company | Offshore | 148,762 | 2 | 67 | 20 | 45 | 1.34 | 0.97 | 0.46 |
| Production | Contractor | Onshore | 902,138 | 21 | 136 | 107 | 216 | 2.33 | 0.54 | 0.17 |
| Production | Contractor | Offshore | 357,249 | 6 | 217 | 87 | 191 | 1.68 | 1.44 | 0.62 |
| Production | SUBTOTAL | SUBTOTAL | 1,740,612 | 31 | 501 | 246 | 545 | 1.78 | 0.78 | 0.31 |
| Construction | Company | Onshore | 38,778 | 0 | 4 | 1 | 9 | 0.00 | 0.36 | 0.10 |
| Construction | Company | Offshore | 20,241 | 1 | 2 | 3 | 5 | 4.94 | 0.54 | 0.15 |
| Construction | Contractor | Onshore | 573,572 | 3 | 78 | 112 | 142 | 0.52 | 0.58 | 0.14 |
| Construction | Contractor | Offshore | 116,015 | 0 | 25 | 20 | 59 | 0.00 | 0.90 | 0.22 |
| Construction | SUBTOTAL | SUBTOTAL | 748,608 | 4 | 109 | 136 | 215 | 0.53 | 0.62 | 0.15 |
| Unspecified | Company | Onshore | 246,522 | 2 | 31 | 31 | 24 | 0.81 | 0.37 | 0.13 |
| Unspecified | Company | Offshore | 25,085 | 1 | 1 | 6 | 3 | 3.99 | 0.44 | 0.08 |
| Unspecified | Contractor | Onshore | 411,875 | 4 | 84 | 81 | 110 | 0.97 | 0.78 | 0.21 |
| Unspecified | Contractor | Offshore | 77,353 | 1 | 34 | 40 | 50 | 1.29 | 1.62 | 0.45 |
| Unspecified | SUBTOTAL | SUBTOTAL | 760,837 | 8 | 150 | 158 | 187 | 1.05 | 0.73 | 0.21 |
| TOTAL | Company | Onshore | 684,185 | 4 | 127 | 68 | 141 | 0.58 | 0.52 | 0.19 |
| TOTAL | Company | Offshore | 218,756 | 4 | 76 | 30 | 54 | 1.83 | 0.80 | 0.37 |
| TOTAL | Contractor | Onshore | 2,218,787 | 35 | 368 | 362 | 584 | 1.58 | 0.63 | 0.18 |
| TOTAL | Contractor | Offshore | 730,605 | 9 | 345 | 190 | 386 | 1.23 | 1.31 | 0.48 |
| GRAND TOTAL | TOTAL | TOTAL | 3,852,334 | 52 | 916 | 650 | 1,165 | 1.35 | 0.75 | 0.25 |
The following data are presented in relation to the sections where they were used.
Section 2 Overall results
| Year | Company | Contractor | Overall | Onshore | Offshore |
|---|---|---|---|---|---|
| 2016 | 0.90 | 1.97 | 1.73 | 1.50 | 2.37 |
| 2017 | 1.02 | 1.13 | 1.10 | 1.10 | 1.11 |
| 2018 | 0.31 | 1.20 | 1.01 | 1.02 | 0.97 |
| 2019 | 0.46 | 0.92 | 0.82 | 0.78 | 0.95 |
| 2020 | 0.56 | 0.54 | 0.55 | 0.42 | 0.92 |
| 2021 | 0.29 | 0.90 | 0.75 | 0.79 | 0.61 |
| 2022 | 0.30 | 1.62 | 1.28 | 1.27 | 1.29 |
| 2023 | 0.68 | 0.87 | 0.82 | 0.90 | 0.59 |
| 2024 | 0.57 | 0.84 | 0.77 | 0.56 | 1.31 |
| 2025 | 0.89 | 1.49 | 1.35 | 1.34 | 1.37 |
| Year | Company | Contractor | Overall | Onshore | Offshore |
|---|---|---|---|---|---|
| 2016 | 0.45 | 1.17 | 1.00 | 1.08 | 0.79 |
| 2017 | 1.02 | 1.00 | 1.00 | 1.05 | 0.86 |
| 2018 | 0.31 | 1.04 | 0.88 | 0.85 | 0.97 |
| 2019 | 0.30 | 0.84 | 0.72 | 0.68 | 0.83 |
| 2020 | 0.56 | 0.44 | 0.47 | 0.37 | 0.77 |
| 2021 | 0.29 | 0.65 | 0.56 | 0.54 | 0.61 |
| 2022 | 0.15 | 1.46 | 1.12 | 1.11 | 1.15 |
| 2023 | 0.45 | 0.54 | 0.52 | 0.53 | 0.47 |
| 2024 | 0.57 | 0.48 | 0.50 | 0.47 | 0.61 |
| 2025 | 0.89 | 1.08 | 1.04 | 1.03 | 1.05 |
| Year | Company | Contractor | Overall | Onshore | Offshore |
|---|---|---|---|---|---|
| 2016 | 667,335 | 2,228,286 | 2,895,621 | 2,134,946 | 760,675 |
| 2017 | 688,779 | 2,310,260 | 2,999,039 | 2,184,775 | 814,264 |
| 2018 | 653,764 | 2,412,586 | 3,066,350 | 2,244,676 | 821,674 |
| 2019 | 657,258 | 2,381,094 | 3,038,352 | 2,193,257 | 845,095 |
| 2020 | 708,712 | 1,835,489 | 2,544,201 | 1,891,036 | 653,165 |
| 2021 | 686,668 | 1,992,358 | 2,679,026 | 2,021,601 | 657,425 |
| 2022 | 659,717 | 1,919,283 | 2,579,000 | 1,883,492 | 695,508 |
| 2023 | 881,802 | 2,409,580 | 3,291,382 | 2,437,811 | 853,571 |
| 2024 | 1,060,726 | 3,098,151 | 4,158,877 | 3,009,731 | 1,149,146 |
| 2025 | 902,941 | 2,949,393 | 3,852,334 | 2,902,972 | 949,362 |
| Cause | Company | Contractor | Overall | Onshore | Offshore | % of total |
|---|---|---|---|---|---|---|
| Assault or violent act | 0 | 4 | 4 | 4 | 0 | 7.7 |
| Aviation accident | 0 | 3 | 3 | 3 | 0 | 5.8 |
| Caught in, under or between (excl. dropped objects) | 0 | 9 | 9 | 7 | 2 | 17.3 |
| Confined space | 0 | 0 | 0 | 0 | 0 | |
| Cut, puncture, scrape | 0 | 0 | 0 | 0 | 0 | |
| Dropped objects | 1 | 7 | 8 | 7 | 1 | 15.4 |
| Explosion, fire or burns | 1 | 5 | 6 | 2 | 4 | 11.5 |
| Exposure electrical | 0 | 2 | 2 | 2 | 0 | 3.8 |
| Exposure noise, chemical, biological, vibration, extreme temperature | 0 | 1 | 1 | 1 | 0 | 1.9 |
| Falls from height | 0 | 5 | 5 | 4 | 1 | 9.6 |
| Overexertion, strain | 0 | 0 | 0 | 0 | 0 | |
| Pressure release | 0 | 0 | 0 | 0 | 0 | |
| Slips and trips (at same height) | 0 | 0 | 0 | 0 | 0 | |
| Struck by (not dropped object) | 1 | 7 | 8 | 7 | 1 | 15.4 |
| Water related, drowning | 3 | 1 | 4 | 1 | 3 | 7.7 |
| Unspecified - Other | 2 | 0 | 2 | 1 | 1 | 3.8 |
| OVERALL | 8 | 44 | 52 | 39 | 13 |
| Cause | Company | Contractor | Overall | Onshore | Offshore | % of total |
|---|---|---|---|---|---|---|
| Construction, commissioning, decommissioning | 1 | 3 | 4 | 3 | 1 | 7.7 |
| Diving (incl. decompression), subsea, ROV | 0 | 0 | 0 | 0 | 0 | |
| Drilling, workover, well operations | 0 | 9 | 9 | 8 | 1 | 17.3 |
| Excavation, trenching, ground disturbance | 0 | 0 | 0 | 0 | 0 | |
| Lifting, crane, rigging, deck operations | 2 | 4 | 6 | 3 | 3 | 11.5 |
| Maintenance, inspection, testing | 2 | 12 | 14 | 9 | 5 | 26.9 |
| Office, warehouse, accommodation, catering | 0 | 0 | 0 | 0 | 0 | |
| Production operations | 1 | 4 | 5 | 3 | 2 | 9.6 |
| Seismic/survey operations | 0 | 0 | 0 | 0 | 0 | |
| Transport - Air | 0 | 3 | 3 | 3 | 0 | 5.8 |
| Transport - Land | 1 | 9 | 10 | 10 | 0 | 19.2 |
| Transport - Water, incl. marine activity | 0 | 0 | 0 | 0 | 0 | |
| Unspecified - other | 1 | 0 | 1 | 0 | 1 | 1.9 |
| OVERALL | 8 | 44 | 52 | 39 | 13 |
| Year | Company | Contractor | OVERALL | Onshore | Offshore |
|---|---|---|---|---|---|
| 2016 | 0.82 | 1.09 | 1.03 | 0.83 | 1.60 |
| 2017 | 0.78 | 1.01 | 0.96 | 0.80 | 1.37 |
| 2018 | 0.72 | 1.06 | 0.99 | 0.88 | 1.27 |
| 2019 | 0.67 | 0.98 | 0.92 | 0.81 | 1.20 |
| 2020 | 0.49 | 0.78 | 0.70 | 0.59 | 1.01 |
| 2021 | 0.51 | 0.85 | 0.77 | 0.61 | 1.23 |
| 2022 | 0.61 | 0.99 | 0.90 | 0.78 | 1.21 |
| 2023 | 0.57 | 0.94 | 0.84 | 0.75 | 1.11 |
| 2024 | 0.56 | 0.89 | 0.81 | 0.73 | 1.04 |
| 2025 | 0.58 | 0.80 | 0.75 | 0.61 | 1.20 |
| Year | Company | Contractor | OVERALL | Onshore | Offshore |
|---|---|---|---|---|---|
| 2016 | 662,818 | 2,227,323 | 2,890,141 | 2,129,739 | 760,402 |
| 2017 | 639,720 | 2,283,689 | 2,923,409 | 2,112,668 | 810,741 |
| 2018 | 653,764 | 2,412,480 | 3,066,244 | 2,244,676 | 821,568 |
| 2019 | 616,171 | 2,375,066 | 2,991,237 | 2,146,142 | 845,095 |
| 2020 | 649,265 | 1,792,191 | 2,441,456 | 1,791,850 | 649,606 |
| 2021 | 639,681 | 1,992,358 | 2,632,039 | 1,974,614 | 657,425 |
| 2022 | 615,716 | 1,919,004 | 2,534,720 | 1,839,491 | 695,229 |
| 2023 | 881,802 | 2,409,580 | 3,291,382 | 2,437,811 | 853,571 |
| 2024 | 919,061 | 2,875,614 | 3,794,675 | 2,808,139 | 986,536 |
| 2025 | 805,757 | 2,831,059 | 3,636,816 | 2,738,425 | 898,391 |
| Year | Company | Contractor | OVERALL | Onshore | Offshore |
|---|---|---|---|---|---|
| 2016 | 0.24 | 0.28 | 0.27 | 0.20 | 0.45 |
| 2017 | 0.28 | 0.26 | 0.27 | 0.22 | 0.41 |
| 2018 | 0.25 | 0.26 | 0.26 | 0.22 | 0.37 |
| 2019 | 0.24 | 0.24 | 0.24 | 0.19 | 0.36 |
| 2020 | 0.20 | 0.22 | 0.22 | 0.17 | 0.35 |
| 2021 | 0.19 | 0.24 | 0.22 | 0.17 | 0.40 |
| 2022 | 0.26 | 0.28 | 0.28 | 0.22 | 0.44 |
| 2023 | 0.22 | 0.24 | 0.24 | 0.19 | 0.38 |
| 2024 | 0.21 | 0.24 | 0.24 | 0.18 | 0.39 |
| 2025 | 0.23 | 0.26 | 0.25 | 0.18 | 0.46 |
| Year | Company | Contractor | OVERALL | Onshore | Offshore |
|---|---|---|---|---|---|
| 2016 | 667,335 | 2,228,286 | 2,895,621 | 2,134,946 | 760,675 |
| 2017 | 688,779 | 2,310,260 | 2,999,039 | 2,184,775 | 814,264 |
| 2018 | 653,764 | 2,412,586 | 3,066,350 | 2,244,676 | 821,674 |
| 2019 | 657,258 | 2,381,094 | 3,038,352 | 2,193,257 | 845,095 |
| 2020 | 708,712 | 1,835,489 | 2,544,201 | 1,891,036 | 653,165 |
| 2021 | 686,668 | 1,992,358 | 2,679,026 | 2,021,601 | 657,425 |
| 2022 | 659,717 | 1,919,283 | 2,579,000 | 1,883,492 | 695,508 |
| 2023 | 881,802 | 2,409,580 | 3,291,382 | 2,437,811 | 853,571 |
| 2024 | 1,060,726 | 3,098,151 | 4,158,877 | 3,009,731 | 1,149,146 |
| 2025 | 902,941 | 2,949,393 | 3,852,334 | 2,902,972 | 949,362 |
| Cause | Company | Contractor | OVERALL | Onshore | Offshore | % of total |
|---|---|---|---|---|---|---|
| Assault or violent act | 0 | 3 | 3 | 3 | 0 | 0.3 |
| Caught in, under or between (excl. dropped objects) | 33 | 121 | 154 | 80 | 74 | 16.8 |
| Cut, puncture, scrape | 4 | 33 | 37 | 20 | 17 | 4.0 |
| Dropped objects | 8 | 21 | 29 | 23 | 6 | 3.2 |
| Explosion, fire or burns | 5 | 51 | 56 | 26 | 30 | 6.1 |
| Exposure electrical | 4 | 4 | 8 | 6 | 2 | 0.9 |
| Exposure noise, chemical, biological, vibration, extreme temperature | 13 | 23 | 36 | 19 | 17 | 3.9 |
| Falls from height | 13 | 43 | 56 | 30 | 26 | 6.1 |
| Overexertion, strain | 22 | 48 | 70 | 36 | 34 | 7.6 |
| Pressure release | 1 | 6 | 7 | 6 | 1 | 0.8 |
| Slips and trips (at same height) | 50 | 145 | 195 | 114 | 81 | 21.3 |
| Struck by (not dropped object) | 26 | 112 | 138 | 78 | 60 | 15.1 |
| Water related, drowning | 1 | 2 | 3 | 0 | 3 | 0.3 |
| Unspecified - Other | 23 | 101 | 124 | 54 | 70 | 13.5 |
| OVERALL | 203 | 713 | 916 | 495 | 421 |
| Activity | Company | Contractor | OVERALL | Onshore | Offshore | % of total |
|---|---|---|---|---|---|---|
| Construction, commissioning, decommissioning | 5 | 119 | 124 | 73 | 51 | 13.5 |
| Diving (incl. decompression), subsea, ROV | 0 | 4 | 4 | 0 | 4 | 0.4 |
| Drilling, workover, well operations | 19 | 125 | 144 | 98 | 46 | 15.7 |
| Excavation, trenching, ground disturbance | 2 | 6 | 8 | 8 | 0 | 0.9 |
| Lifting, crane, rigging, deck operations | 12 | 65 | 77 | 34 | 43 | 8.4 |
| Maintenance, inspection, testing | 53 | 120 | 173 | 74 | 99 | 18.9 |
| Office, warehouse, accommodation, catering | 16 | 46 | 62 | 32 | 30 | 6.8 |
| Production operations | 54 | 96 | 150 | 82 | 68 | 16.4 |
| Seismic/survey operations | 0 | 2 | 2 | 1 | 1 | 0.2 |
| Transport - Land | 9 | 13 | 22 | 22 | 0 | 2.4 |
| Transport - Water, incl. marine activity | 0 | 13 | 13 | 1 | 12 | 1.4 |
| Unspecified - other | 33 | 104 | 137 | 70 | 67 | 15.0 |
| OVERALL | 203 | 713 | 916 | 495 | 421 |
| Year | Average number of days lost per LWDC | ||||
|---|---|---|---|---|---|
| Company | Contractor | OVERALL | Onshore | Offshore | |
| 2016 | 37.6 | 66.9 | 61.4 | 46.9 | 79.2 |
| 2017 | 40.5 | 43.0 | 42.5 | 45.1 | 39.0 |
| 2018 | 37.7 | 54.6 | 51.5 | 49.4 | 54.9 |
| 2019 | 44.8 | 52.5 | 50.9 | 53.8 | 46.7 |
| 2020 | 40.1 | 42.9 | 42.3 | 39.2 | 47.6 |
| 2021 | 56.4 | 51.4 | 52.4 | 53.9 | 50.1 |
| 2022 | 38.3 | 42.4 | 41.3 | 45.4 | 34.9 |
| 2023 | 42.9 | 52.5 | 50.0 | 46.2 | 56.1 |
| 2024 | 50.3 | 43.6 | 45.3 | 47.5 | 42.3 |
| 2025 | 55.0 | 38.3 | 42.3 | 42.7 | 41.7 |
| Year | Average number of days restricted per RWDC | ||||
|---|---|---|---|---|---|
| Company | Contractor | OVERALL | Onshore | Offshore | |
| 2016 | 14.4 | 14.4 | 14.4 | 13.8 | 15.6 |
| 2017 | 12.5 | 18.0 | 17.2 | 17.1 | 17.6 |
| 2018 | 16.7 | 19.8 | 19.4 | 19.9 | 18.9 |
| 2019 | 23.5 | 23.7 | 23.7 | 25.4 | 21.4 |
| 2020 | 32.2 | 25.9 | 26.4 | 31.5 | 19.7 |
| 2021 | 41.2 | 23.4 | 26.3 | 26.3 | 26.2 |
| 2022 | 31.8 | 27.9 | 28.5 | 27.0 | 31.0 |
| 2023 | 23.0 | 24.7 | 24.5 | 25.3 | 22.9 |
| 2024 | 30.0 | 34.2 | 33.6 | 33.1 | 34.7 |
| 2025 | 22.8 | 24.7 | 24.4 | 22.4 | 28.5 |
| Life-Saving Rule | Fatal incidents | ||||
|---|---|---|---|---|---|
| 2019 | 2020 | 2021 | 2022 | 2023 | |
| Bypassing safety controls | 0 | 0 | 2 | 1 | 2 |
| Confined space | 0 | 0 | 0 | 2 | 1 |
| Driving | 1 | 2 | 3 | 4 | 3 |
| Energy isolation | 1 | 4 | 1 | 1 | 4 |
| Hot work | 0 | 3 | 0 | 1 | 2 |
| Line of fire | 5 | 12 | 2 | 3 | 12 |
| Safe mechanical lifting | 3 | 2 | 2 | 1 | 6 |
| Work authorization | 0 | 1 | 1 | 3 | 1 |
| Working at height | 4 | 1 | 2 | 2 | 3 |
| Other issue – no applicable rule | 0 | 4 | 4 | 3 | 5 |
| Unspecified | 1 | 0 | 0 | 0 | 1 |
| Life-Saving Rule | Lost work day cases | ||||
|---|---|---|---|---|---|
| 2019 | 2020 | 2021 | 2022 | 2023 | |
| Bypassing safety controls | 5 | 5 | 23 | 25 | 13 |
| Confined space | 2 | 7 | 2 | 7 | 6 |
| Driving | 7 | 13 | 16 | 33 | 20 |
| Energy isolation | 20 | 20 | 22 | 22 | 33 |
| Hot work | 7 | 6 | 4 | 5 | 7 |
| Line of fire | 109 | 176 | 210 | 215 | 255 |
| Safe mechanical lifting | 42 | 23 | 47 | 46 | 43 |
| Work authorization | 7 | 17 | 13 | 28 | 24 |
| Working at height | 44 | 37 | 30 | 41 | 42 |
| Other issue – no applicable rule | 200 | 180 | 140 | 186 | 176 |
| Unspecified | 137 | 198 | 241 | 338 | 297 |
Section 3 Results by region
| Region | Fatalities | Fatal incidents | ||||||||
|---|---|---|---|---|---|---|---|---|---|---|
| 2019 | 2020 | 2021 | 2022 | 2023 | 2019 | 2020 | 2021 | 2022 | 2023 | |
| Africa | 7 | 2 | 5 | 8 | 8 | 2 | 2 | 4 | 3 | 5 |
| Asia/Australasia | 0 | 7 | 11 | 3 | 18 | 0 | 7 | 5 | 2 | 15 |
| Europe | 2 | 0 | 0 | 1 | 1 | 2 | 0 | 0 | 1 | 1 |
| Middle East | 4 | 11 | 4 | 9 | 8 | 4 | 8 | 3 | 6 | 7 |
| North America | 1 | 4 | 3 | 7 | 5 | 1 | 4 | 3 | 5 | 5 |
| Russia & Central Asia | 2 | 3 | 4 | 2 | 8 | 2 | 2 | 2 | 2 | 5 |
| South & Central America | 4 | 6 | 0 | 2 | 4 | 4 | 6 | 0 | 2 | 2 |
| OVERALL | 20 | 33 | 27 | 32 | 52 | 15 | 29 | 17 | 21 | 40 |
| Region | Fatal accident rate (FAR) | ||||
|---|---|---|---|---|---|
| 2019 | 2020 | 2021 | 2022 | 2023 | |
| Africa | 2.16 | 0.54 | 1.29 | 1.67 | 2.04 |
| Asia/Australasia | 0.00 | 1.44 | 1.94 | 0.34 | 2.29 |
| Europe | 0.87 | 0.00 | 0.00 | 0.43 | 0.47 |
| Middle East | 0.60 | 2.17 | 0.40 | 0.77 | 0.65 |
| North America | 0.38 | 1.21 | 0.78 | 0.93 | 0.78 |
| Russia & Central Asia | 0.60 | 0.94 | 1.29 | 0.88 | 3.47 |
| South & Central America | 1.14 | 1.93 | 0.00 | 0.48 | 1.15 |
| OVERALL | 0.75 | 1.28 | 0.82 | 0.77 | 1.35 |
| Region | Total recordable injury rate (TRIR) | ||||
|---|---|---|---|---|---|
| 2019 | 2020 | 2021 | 2022 | 2023 | |
| Africa | 0.39 | 0.37 | 0.36 | 0.42 | 0.53 |
| Asia/Australasia | 0.69 | 0.77 | 0.66 | 0.53 | 0.59 |
| Europe | 1.93 | 1.82 | 1.67 | 2.06 | 2.21 |
| Middle East | 0.30 | 0.30 | 0.40 | 0.44 | 0.37 |
| North America | 1.40 | 1.61 | 1.70 | 1.62 | 1.41 |
| Russia & Central Asia | 0.46 | 0.60 | 0.52 | 0.67 | 0.72 |
| South & Central America | 1.14 | 1.45 | 1.62 | 1.43 | 1.05 |
| OVERALL | 0.77 | 0.90 | 0.84 | 0.81 | 0.75 |
| Region | Lost time injury rate (LTIR) | ||||
|---|---|---|---|---|---|
| 2019 | 2020 | 2021 | 2022 | 2023 | |
| Africa | 0.13 | 0.11 | 0.10 | 0.16 | 0.19 |
| Asia/Australasia | 0.14 | 0.16 | 0.14 | 0.12 | 0.12 |
| Europe | 0.82 | 0.77 | 0.68 | 0.91 | 1.02 |
| Middle East | 0.06 | 0.09 | 0.10 | 0.11 | 0.12 |
| North America | 0.23 | 0.33 | 0.35 | 0.28 | 0.26 |
| Russia & Central Asia | 0.15 | 0.16 | 0.17 | 0.24 | 0.35 |
| South & Central America | 0.42 | 0.63 | 0.52 | 0.46 | 0.52 |
| OVERALL | 0.22 | 0.28 | 0.24 | 0.24 | 0.25 |
| Region | Thousand work hours | |||||||||
|---|---|---|---|---|---|---|---|---|---|---|
| 2014 | 2015 | 2016 | 2017 | 2018 | 2019 | 2020 | 2021 | 2022 | 2023 | |
| Africa | 444,534 | 489,592 | 537,130 | 480,700 | 322,739 | 323,847 | 371,510 | 388,712 | 478,530 | 392,253 |
| Asia/Australasia | 745,095 | 595,521 | 531,067 | 594,527 | 531,985 | 510,335 | 486,294 | 567,832 | 877,373 | 786,218 |
| Europe | 273,984 | 248,856 | 250,880 | 275,861 | 233,754 | 231,120 | 250,769 | 256,096 | 230,398 | 215,038 |
| Middle East | 607,678 | 754,753 | 756,946 | 675,784 | 591,323 | 670,571 | 507,003 | 1,008,695 | 1,170,824 | 1,234,235 |
| North America | 325,869 | 326,804 | 367,241 | 369,476 | 259,026 | 260,595 | 331,406 | 383,252 | 756,140 | 644,440 |
| Russia & Central Asia | 166,000 | 235,205 | 220,906 | 246,248 | 283,302 | 332,910 | 320,670 | 309,121 | 228,189 | 230,872 |
| South & Central America | 332,461 | 348,308 | 402,180 | 395,756 | 322,072 | 349,648 | 311,348 | 377,671 | 417,421 | 349,275 |
| OVERALL | 2,895,621 | 2,999,039 | 3,066,350 | 3,038,352 | 2,544,201 | 2,679,026 | 2,579,000 | 3,291,382 | 4,158,877 | 3,852,334 |
| Region | FAR five-year rolling average | |||||||||
|---|---|---|---|---|---|---|---|---|---|---|
| 2014 | 2015 | 2016 | 2017 | 2018 | 2019 | 2020 | 2021 | 2022 | 2023 | |
| Africa | 2.50 | 2.19 | 1.43 | 1.52 | 1.32 | 1.25 | 1.13 | 1.17 | 1.27 | 1.53 |
| Asia/Australasia | 1.16 | 1.03 | 1.06 | 0.91 | 0.90 | 0.43 | 0.60 | 0.82 | 0.81 | 1.21 |
| Europe | 1.85 | 1.88 | 1.46 | 1.44 | 1.25 | 0.32 | 0.32 | 0.32 | 0.25 | 0.34 |
| Middle East | 1.01 | 0.74 | 0.86 | 0.90 | 0.86 | 0.78 | 1.03 | 0.81 | 0.84 | 0.78 |
| North America | 2.79 | 1.92 | 1.72 | 1.78 | 1.33 | 1.20 | 0.94 | 1.00 | 0.85 | 0.84 |
| Russia & Central Asia | 0.87 | 1.41 | 1.43 | 1.34 | 1.13 | 1.14 | 0.78 | 0.80 | 0.88 | 1.34 |
| South & Central America | 1.61 | 1.75 | 1.08 | 1.11 | 0.89 | 1.05 | 1.18 | 0.85 | 0.67 | 0.89 |
| OVERALL | 1.72 | 1.48 | 1.25 | 1.23 | 1.05 | 0.86 | 0.88 | 0.84 | 0.83 | 0.99 |
| Region | TRIR five-year rolling average | |||||||||
|---|---|---|---|---|---|---|---|---|---|---|
| 2014 | 2015 | 2016 | 2017 | 2018 | 2019 | 2020 | 2021 | 2022 | 2023 | |
| Africa | 0.92 | 0.79 | 0.67 | 0.54 | 0.46 | 0.44 | 0.41 | 0.38 | 0.38 | 0.41 |
| Asia/Australasia | 1.01 | 0.91 | 0.87 | 0.78 | 0.68 | 0.65 | 0.65 | 0.64 | 0.61 | 0.63 |
| Europe | 2.44 | 2.34 | 2.25 | 2.16 | 2.09 | 2.06 | 2.01 | 1.91 | 1.86 | 1.93 |
| Middle East | 0.80 | 0.70 | 0.60 | 0.52 | 0.46 | 0.43 | 0.38 | 0.37 | 0.38 | 0.38 |
| North America | 2.40 | 2.24 | 2.12 | 1.94 | 1.74 | 1.66 | 1.59 | 1.52 | 1.52 | 1.55 |
| Russia & Central Asia | 0.75 | 0.62 | 0.56 | 0.56 | 0.50 | 0.49 | 0.52 | 0.52 | 0.53 | 0.58 |
| South & Central America | 2.69 | 2.34 | 1.98 | 1.60 | 1.47 | 1.34 | 1.34 | 1.33 | 1.35 | 1.34 |
| OVERALL | 1.45 | 1.30 | 1.17 | 1.03 | 0.93 | 0.88 | 0.86 | 0.83 | 0.81 | 0.81 |
| Region | LTIR five-year rolling average | |||||||||
|---|---|---|---|---|---|---|---|---|---|---|
| 2014 | 2015 | 2016 | 2017 | 2018 | 2019 | 2020 | 2021 | 2022 | 2023 | |
| Africa | 0.26 | 0.23 | 0.19 | 0.15 | 0.14 | 0.13 | 0.13 | 0.11 | 0.12 | 0.14 |
| Asia/Australasia | 0.17 | 0.15 | 0.16 | 0.15 | 0.14 | 0.13 | 0.13 | 0.13 | 0.13 | 0.13 |
| Europe | 0.84 | 0.81 | 0.74 | 0.74 | 0.75 | 0.77 | 0.77 | 0.77 | 0.78 | 0.83 |
| Middle East | 0.18 | 0.15 | 0.13 | 0.11 | 0.10 | 0.09 | 0.08 | 0.09 | 0.09 | 0.10 |
| North America | 0.55 | 0.46 | 0.40 | 0.38 | 0.34 | 0.31 | 0.30 | 0.30 | 0.29 | 0.29 |
| Russia & Central Asia | 0.23 | 0.20 | 0.17 | 0.15 | 0.16 | 0.16 | 0.16 | 0.16 | 0.18 | 0.20 |
| South & Central America | 0.73 | 0.71 | 0.63 | 0.54 | 0.51 | 0.48 | 0.48 | 0.48 | 0.48 | 0.51 |
| OVERALL | 0.38 | 0.33 | 0.29 | 0.27 | 0.25 | 0.24 | 0.24 | 0.24 | 0.24 | 0.24 |
| Region | Average days lost per LWDC | ||||
|---|---|---|---|---|---|
| 2019 | 2020 | 2021 | 2022 | 2023 | |
| Africa | 24.5 | 39.6 | 43.8 | 40.1 | 21.7 |
| Asia/Australasia | 59.4 | 40.8 | 40.3 | 37.4 | 50.3 |
| Europe | 35.9 | 38.3 | 50.0 | 43.9 | 49.0 |
| Middle East | 58.5 | 23.6 | 25.0 | 22.9 | 26.5 |
| North America | 29.5 | 58.9 | 57.5 | 59.7 | 56.7 |
| Russia & Central Asia | 79.3 | 54.8 | 70.3 | 52.8 | 64.2 |
| South & Central America | 64.9 | 37.8 | 58.4 | 54.6 | 33.8 |
| OVERALL | 52.4 | 41.3 | 50.0 | 45.3 | 42.3 |
Countries with less than 50,000 reported work hours or with fewer than 2 companies reporting in 2023 or the reporting year are excluded.
Iran and Russia are excluded.
| Region | Country | Total recordable injury rate (TRIR) | ||
|---|---|---|---|---|
| 2021 | 2022 | 2023 | ||
| Africa | Cameroon | 1.22 | 2.67 | |
| Africa | Gabon | 1.03 | 2.72 | 1.85 |
| Africa | Mauritania | 0.00 | 1.81 | 1.71 |
| Africa | Equatorial Guinea | 0.76 | 1.17 | 1.58 |
| Africa | Namibia | 1.79 | 1.17 | 1.17 |
| Africa | Tunisia | 1.01 | 0.24 | 0.98 |
| Africa | Angola | 0.55 | 0.80 | 0.68 |
| Africa | Ghana | 0.15 | 0.15 | 0.67 |
| Africa | AFRICA AVERAGE | 0.36 | 0.42 | 0.53 |
| Africa | Libya | 0.13 | 0.04 | 0.40 |
| Africa | Congo | 0.21 | 0.14 | 0.36 |
| Africa | Ivory Coast | 0.24 | 0.26 | 0.29 |
| Africa | Nigeria | 0.33 | 0.26 | 0.27 |
| Africa | Algeria | 0.56 | 0.45 | 0.22 |
| Africa | Egypt | 0.07 | 0.35 | 0.14 |
| Africa | Mozambique | 0.00 | 0.00 | 0.00 |
| Africa | São Tomé and Príncipe | 0.00 | 0.00 | |
| Africa | Senegal | 1.49 | 0.42 | 0.00 |
| Africa | South Africa | 0.00 | 0.00 | 0.00 |
| Africa | Tanzania | 0.00 | 0.00 | 0.00 |
| Asia/Australasia | Australia | 3.66 | 4.22 | 3.44 |
| Asia/Australasia | Japan | 2.17 | 0.99 | 0.89 |
| Asia/Australasia | Thailand | 0.72 | 0.77 | 0.61 |
| Asia/Australasia | ASIA/AUSTRALASIA AVERAGE | 0.66 | 0.53 | 0.59 |
| Asia/Australasia | India | 0.51 | 0.52 | 0.55 |
| Asia/Australasia | Brunei | 1.32 | 0.00 | 0.51 |
| Asia/Australasia | Philippines | 1.99 | 0.47 | |
| Asia/Australasia | Malaysia | 0.35 | 0.54 | 0.27 |
| Asia/Australasia | Papua New Guinea | 0.10 | 0.19 | 0.25 |
| Asia/Australasia | Singapore | 0.00 | 0.53 | 0.24 |
| Asia/Australasia | South Korea | 0.00 | 10.31 | 0.20 |
| Asia/Australasia | Indonesia | 0.25 | 0.11 | 0.17 |
| Asia/Australasia | China | 0.05 | 0.09 | 0.06 |
| Asia/Australasia | Vietnam | 0.73 | 0.00 | 0.00 |
| Europe | Norway | 2.26 | 2.53 | 2.67 |
| Europe | Germany | 2.95 | 1.54 | 2.61 |
| Europe | Cyprus | 1.53 | 3.76 | 2.47 |
| Europe | EUROPE AVERAGE | 1.67 | 2.06 | 2.21 |
| Europe | UK | 1.10 | 2.40 | 2.20 |
| Europe | Netherlands | 1.09 | 1.28 | 2.03 |
| Europe | Italy | 1.25 | 1.48 | 1.79 |
| Europe | Denmark | 2.11 | 1.34 | |
| Europe | Albania | 1.32 | 0.00 | 0.00 |
| Europe | France | 0.00 | 1.08 | 0.00 |
| Middle East | Kurdistan Region Of Iraq | 1.87 | 1.74 | 1.26 |
| Middle East | Qatar | 0.77 | 0.84 | 0.69 |
| Middle East | MIDDLE EAST AVERAGE | 0.40 | 0.44 | 0.37 |
| Middle East | Iraq | 0.20 | 0.23 | 0.33 |
| Middle East | Kuwait | 0.36 | 0.28 | 0.26 |
| Middle East | Oman | 0.48 | 0.50 | 0.26 |
| Middle East | UAE | 0.13 | 0.14 | 0.10 |
| Middle East | Turkey | 1.19 | 0.00 | |
| North America | Canada | 1.56 | 1.86 | 1.83 |
| North America | NORTH AMERICA AVERAGE | 1.70 | 1.62 | 1.41 |
| North America | USA | 1.79 | 1.58 | 1.33 |
| North America | Mexico | 0.49 | 0.53 | 0.56 |
| Russia & Central Asia | Azerbaijan | 0.64 | 1.00 | 1.11 |
| Russia & Central Asia | RUSSIA & CENTRAL ASIA AVERAGE | 0.52 | 0.67 | 0.72 |
| Russia & Central Asia | Kazakhstan | 0.46 | 0.44 | 0.48 |
| South & Central America | Trinidad and Tobago | 1.37 | 1.08 | 1.42 |
| South & Central America | Bolivia | 0.19 | 0.36 | 1.15 |
| South & Central America | Brazil | 1.29 | 1.11 | 1.15 |
| South & Central America | SOUTH & CENTRAL AMERICA AVERAGE | 1.62 | 1.43 | 1.05 |
| South & Central America | Peru | 0.29 | 1.14 | 0.99 |
| South & Central America | Argentina | 2.78 | 2.39 | 0.61 |
| South & Central America | Colombia | 1.31 | 0.00 | 0.00 |
| South & Central America | Suriname | 0.76 | 0.00 | 0.00 |
| South & Central America | Venezuela | 0.00 | 0.65 | 0.00 |
Iran and Russia are excluded.
| Region | Country | Lost time injury rate (LTIR) | ||
|---|---|---|---|---|
| 2021 | 2022 | 2023 | ||
| Africa | Mauritania | 0.00 | 1.21 | 1.71 |
| Africa | Namibia | 0.36 | 0.00 | 1.17 |
| Africa | Gabon | 0.41 | 1.82 | 0.85 |
| Africa | Tunisia | 0.61 | 0.39 | 0.59 |
| Africa | Equatorial Guinea | 0.19 | 0.33 | 0.40 |
| Africa | Cameroon | 0.32 | 0.31 | |
| Africa | Angola | 0.05 | 0.09 | 0.30 |
| Africa | AFRICA AVERAGE | 0.10 | 0.16 | 0.19 |
| Africa | Algeria | 0.13 | 0.06 | 0.11 |
| Africa | Congo | 0.06 | 0.03 | 0.08 |
| Africa | Nigeria | 0.14 | 0.05 | 0.08 |
| Africa | Egypt | 0.02 | 0.13 | 0.03 |
| Africa | Ghana | 0.15 | 0.00 | 0.00 |
| Africa | Ivory Coast | 0.00 | 0.00 | 0.00 |
| Africa | Libya | 0.04 | 0.04 | 0.00 |
| Africa | Mozambique | 0.00 | 0.00 | 0.00 |
| Africa | São Tomé and Príncipe | 0.00 | 0.00 | |
| Africa | Senegal | 0.25 | 0.00 | 0.00 |
| Africa | South Africa | 0.00 | 0.00 | 0.00 |
| Africa | Tanzania | 0.00 | 0.00 | 0.00 |
| Asia/Australasia | Australia | 0.57 | 0.68 | 0.60 |
| Asia/Australasia | Singapore | 0.00 | 0.40 | 0.24 |
| Asia/Australasia | Japan | 0.54 | 0.20 | 0.22 |
| Asia/Australasia | South Korea | 0.00 | 10.31 | 0.20 |
| Asia/Australasia | India | 0.15 | 0.15 | 0.14 |
| Asia/Australasia | ASIA/AUSTRALASIA AVERAGE | 0.14 | 0.12 | 0.12 |
| Asia/Australasia | Malaysia | 0.09 | 0.26 | 0.11 |
| Asia/Australasia | Thailand | 0.09 | 0.16 | 0.10 |
| Asia/Australasia | Brunei | 0.00 | 0.00 | 0.09 |
| Asia/Australasia | Indonesia | 0.03 | 0.02 | 0.04 |
| Asia/Australasia | China | 0.03 | 0.04 | 0.00 |
| Asia/Australasia | Papua New Guinea | 0.00 | 0.00 | 0.00 |
| Asia/Australasia | Philippines | 0.00 | 0.00 | |
| Asia/Australasia | Vietnam | 0.00 | 0.00 | 0.00 |
| Europe | Italy | 1.08 | 1.25 | 1.59 |
| Europe | UK | 0.26 | 0.93 | 1.12 |
| Europe | Norway | 0.90 | 0.99 | 1.09 |
| Europe | EUROPE AVERAGE | 0.68 | 0.91 | 1.02 |
| Europe | Germany | 0.87 | 0.38 | 0.58 |
| Europe | Netherlands | 0.18 | 0.89 | 0.56 |
| Europe | Denmark | 0.59 | 0.45 | |
| Europe | Albania | 0.00 | 0.00 | 0.00 |
| Europe | Cyprus | 0.00 | 0.00 | 0.00 |
| Europe | France | 0.00 | 0.00 | 0.00 |
| Middle East | Qatar | 0.13 | 0.18 | 0.19 |
| Middle East | Iraq | 0.07 | 0.08 | 0.15 |
| Middle East | Kuwait | 0.18 | 0.08 | 0.12 |
| Middle East | MIDDLE EAST AVERAGE | 0.10 | 0.11 | 0.12 |
| Middle East | Oman | 0.14 | 0.18 | 0.05 |
| Middle East | UAE | 0.03 | 0.05 | 0.05 |
| Middle East | Kurdistan Region Of Iraq | 0.14 | 0.58 | 0.00 |
| Middle East | Turkey | 0.00 | 0.00 | |
| North America | USA | 0.42 | 0.44 | 0.34 |
| North America | NORTH AMERICA AVERAGE | 0.35 | 0.28 | 0.26 |
| North America | Mexico | 0.25 | 0.18 | 0.20 |
| North America | Canada | 0.15 | 0.12 | 0.10 |
| Russia & Central Asia | Azerbaijan | 0.24 | 0.34 | 0.39 |
| Russia & Central Asia | RUSSIA & CENTRAL ASIA AVERAGE | 0.17 | 0.24 | 0.35 |
| Russia & Central Asia | Kazakhstan | 0.13 | 0.17 | 0.32 |
| South & Central America | Brazil | 0.66 | 0.61 | 0.62 |
| South & Central America | Peru | 0.14 | 0.47 | 0.58 |
| South & Central America | SOUTH & CENTRAL AMERICA AVERAGE | 0.52 | 0.46 | 0.52 |
| South & Central America | Bolivia | 0.19 | 0.18 | 0.38 |
| South & Central America | Trinidad and Tobago | 0.31 | 0.34 | 0.26 |
| South & Central America | Argentina | 0.41 | 0.24 | 0.19 |
| South & Central America | Colombia | 0.44 | 0.00 | 0.00 |
| South & Central America | Suriname | 0.00 | 0.00 | 0.00 |
| South & Central America | Venezuela | 0.00 | 0.00 | 0.00 |
Section 4 Results by function
| Function | Fatal incidents | Fatalities | ||||||||
|---|---|---|---|---|---|---|---|---|---|---|
| 2019 | 2020 | 2021 | 2022 | 2023 | 2019 | 2020 | 2021 | 2022 | 2023 | |
| Exploration | 0 | 1 | 0 | 0 | 0 | 0 | 1 | 0 | 0 | 0 |
| Drilling | 7 | 7 | 2 | 6 | 8 | 7 | 8 | 2 | 6 | 9 |
| Production | 5 | 11 | 10 | 13 | 20 | 5 | 13 | 13 | 19 | 31 |
| Construction | 3 | 4 | 2 | 1 | 4 | 8 | 4 | 4 | 1 | 4 |
| Unspecified | 0 | 6 | 3 | 1 | 8 | 0 | 7 | 8 | 6 | 8 |
| OVERALL | 15 | 29 | 17 | 21 | 40 | 20 | 33 | 27 | 32 | 52 |
| Function | Hours (thousands) | ||||
|---|---|---|---|---|---|
| 2019 | 2020 | 2021 | 2022 | 2023 | |
| Exploration | 37,838 | 29,118 | 42,920 | 55,709 | 75,214 |
| Drilling | 328,583 | 326,310 | 493,511 | 714,524 | 527,062 |
| Production | 1,326,571 | 1,267,104 | 1,499,781 | 1,847,122 | 1,740,612 |
| Construction | 559,086 | 461,358 | 605,228 | 804,614 | 748,608 |
| Unspecified | 426,948 | 495,110 | 649,940 | 736,907 | 760,837 |
| OVERALL | 2,679,026 | 2,579,000 | 3,291,382 | 4,158,877 | 3,852,334 |
| Function | FAR five-year rolling average | |||||
|---|---|---|---|---|---|---|
| 2018 | 2019 | 2020 | 2021 | 2022 | 2023 | |
| Exploration | 1.04 | 0.55 | 1.16 | 0.55 | 0.50 | 0.42 |
| Drilling | 2.41 | 2.47 | 2.13 | 1.45 | 1.33 | 1.34 |
| Production | 1.18 | 0.76 | 0.74 | 0.78 | 0.77 | 1.05 |
| Construction | 0.48 | 0.56 | 0.68 | 0.71 | 0.61 | 0.66 |
| Unspecified | 0.61 | 0.42 | 0.62 | 0.73 | 0.84 | 0.94 |
| OVERALL | 1.05 | 0.86 | 0.88 | 0.84 | 0.83 | 0.99 |
| Function | Fatal accident rate (FAR) | |||||
|---|---|---|---|---|---|---|
| 2018 | 2019 | 2020 | 2021 | 2022 | 2023 | |
| Exploration | 0.00 | 0.00 | 3.43 | 0.00 | 0.00 | 0.00 |
| Drilling | 1.94 | 2.13 | 2.45 | 0.41 | 0.84 | 1.71 |
| Production | 0.36 | 0.38 | 1.03 | 0.87 | 1.03 | 1.78 |
| Construction | 0.18 | 1.43 | 0.87 | 0.66 | 0.12 | 0.53 |
| Unspecified | 0.55 | 0.00 | 1.41 | 1.23 | 0.81 | 1.05 |
| OVERALL | 0.55 | 0.75 | 1.28 | 0.82 | 0.77 | 1.35 |
| Function | TRIR five-year rolling average | |||||
|---|---|---|---|---|---|---|
| 2018 | 2019 | 2020 | 2021 | 2022 | 2023 | |
| Exploration | 1.06 | 0.93 | 0.87 | 0.68 | 0.51 | 0.40 |
| Drilling | 1.69 | 1.62 | 1.61 | 1.51 | 1.26 | 1.17 |
| Production | 1.04 | 0.94 | 0.89 | 0.82 | 0.81 | 0.82 |
| Construction | 0.65 | 0.63 | 0.66 | 0.66 | 0.69 | 0.71 |
| Unspecified | 0.54 | 0.54 | 0.54 | 0.57 | 0.58 | 0.65 |
| OVERALL | 0.93 | 0.88 | 0.86 | 0.83 | 0.81 | 0.81 |
| Function | Total recordable injury rate (TRIR) | |||||
|---|---|---|---|---|---|---|
| 2018 | 2019 | 2020 | 2021 | 2022 | 2023 | |
| Exploration | 0.87 | 0.48 | 0.27 | 0.47 | 0.49 | 0.31 |
| Drilling | 1.47 | 1.33 | 1.68 | 1.29 | 0.91 | 0.94 |
| Production | 0.72 | 0.79 | 0.84 | 0.82 | 0.85 | 0.78 |
| Construction | 0.49 | 0.59 | 0.81 | 0.75 | 0.79 | 0.62 |
| Unspecified | 0.42 | 0.50 | 0.64 | 0.66 | 0.64 | 0.73 |
| OVERALL | 0.70 | 0.77 | 0.90 | 0.84 | 0.81 | 0.75 |
| Function | LTIR five-year rolling average | |||||
|---|---|---|---|---|---|---|
| 2018 | 2019 | 2020 | 2021 | 2022 | 2023 | |
| Exploration | 0.37 | 0.41 | 0.41 | 0.37 | 0.24 | 0.17 |
| Drilling | 0.49 | 0.46 | 0.45 | 0.41 | 0.35 | 0.32 |
| Production | 0.30 | 0.28 | 0.28 | 0.27 | 0.27 | 0.28 |
| Construction | 0.14 | 0.14 | 0.15 | 0.15 | 0.15 | 0.16 |
| Unspecified | 0.14 | 0.13 | 0.13 | 0.14 | 0.16 | 0.18 |
| OVERALL | 0.25 | 0.24 | 0.24 | 0.24 | 0.24 | 0.24 |
| Function | Lost time injury rate (LTIR) | |||||
|---|---|---|---|---|---|---|
| 2018 | 2019 | 2020 | 2021 | 2022 | 2023 | |
| Exploration | 0.42 | 0.37 | 0.14 | 0.21 | 0.13 | 0.11 |
| Drilling | 0.47 | 0.40 | 0.44 | 0.30 | 0.27 | 0.30 |
| Production | 0.24 | 0.25 | 0.32 | 0.27 | 0.26 | 0.31 |
| Construction | 0.12 | 0.15 | 0.18 | 0.15 | 0.17 | 0.15 |
| Unspecified | 0.12 | 0.08 | 0.17 | 0.18 | 0.21 | 0.21 |
| OVERALL | 0.22 | 0.22 | 0.28 | 0.24 | 0.24 | 0.25 |
| Function | Average days lost per LWDC | |||||
|---|---|---|---|---|---|---|
| 2018 | 2019 | 2020 | 2021 | 2022 | 2023 | |
| Exploration | 33.3 | 35.2 | 2.7 | 32.5 | 42.0 | 38.5 |
| Drilling | 53.4 | 70.6 | 55.0 | 66.8 | 51.8 | 45.5 |
| Production | 34.0 | 45.6 | 32.9 | 43.0 | 44.6 | 44.1 |
| Construction | 47.4 | 59.6 | 59.8 | 57.0 | 39.6 | 39.9 |
| Unspecified | 44.3 | 40.0 | 43.7 | 46.1 | 44.5 | 36.3 |
| OVERALL | 42.3 | 52.4 | 41.3 | 50.0 | 45.3 | 42.3 |
| Region | Exploration TRIR | Work hours (thousands) | ||||
|---|---|---|---|---|---|---|
| Company | Contractor | 2023 | ||||
| 2018-2022 | 2023 | 2018-2022 | 2023 | Company | Contractor | |
| Africa | 0.09 | 0.00 | 0.71 | 0.00 | 1,038 | 699 |
| Asia/Australasia | 0.00 | 0.00 | 0.29 | 0.22 | 2,854 | 4,558 |
| Europe | 1.05 | 0.00 | 1.41 | 1.55 | 3,529 | 1,290 |
| Middle East | 0.23 | 0.22 | 0.17 | 0.03 | 4,556 | 29,352 |
| North America | 0.20 | 4.89 | 0.71 | 1.87 | 613 | 1,066 |
| Russia & Central Asia | 0.17 | 0.00 | 0.00 | 0.00 | 1,276 | 248 |
| South & Central America | 0.00 | 0.41 | 1.83 | 3.22 | 2,412 | 1,862 |
| OVERALL | 0.36 | 0.31 | 0.66 | 0.31 | 16,280 | 39,077 |
| Region | Exploration LTIR | Work hours (thousands) | ||||
|---|---|---|---|---|---|---|
| Company | Contractor | 2023 | ||||
| 2018-2022 | 2023 | 2018-2022 | 2023 | Company | Contractor | |
| Africa | 0.09 | 0.00 | 0.19 | 0.00 | 1,038 | 699 |
| Asia/Australasia | 0.00 | 0.00 | 0.12 | 0.22 | 2,854 | 4,558 |
| Europe | 1.01 | 0.00 | 0.54 | 0.77 | 3,529 | 1,290 |
| Middle East | 0.00 | 0.00 | 0.00 | 0.03 | 4,556 | 29,352 |
| North America | 0.00 | 0.00 | 0.07 | 0.11 | 2,573 | 18,962 |
| Russia & Central Asia | 0.17 | 0.00 | 0.00 | 0.00 | 1,276 | 248 |
| South & Central America | 0.00 | 0.41 | 0.96 | 1.07 | 2,412 | 1,862 |
| OVERALL | 0.29 | 0.05 | 0.21 | 0.12 | 18,240 | 56,973 |
| Region | Drilling TRIR | Work hours (thousands) | ||||
|---|---|---|---|---|---|---|
| Company | Contractor | 2023 | ||||
| 2018-2022 | 2023 | 2018-2022 | 2023 | Company | Contractor | |
| Africa | 0.48 | 0.00 | 0.81 | 0.60 | 3,225 | 38,094 |
| Asia/Australasia | 0.14 | 0.00 | 0.73 | 0.37 | 21,911 | 154,930 |
| Europe | 0.75 | 0.70 | 3.38 | 2.82 | 7,188 | 25,204 |
| Middle East | 0.31 | 0.39 | 0.62 | 0.54 | 5,065 | 117,571 |
| North America | 0.46 | 0.60 | 2.95 | 2.75 | 3,323 | 55,343 |
| Russia & Central Asia | 1.25 | 3.00 | 1.08 | 1.96 | 3,670 | 6,112 |
| South & Central America | 0.35 | 0.39 | 2.44 | 1.40 | 5,160 | 45,146 |
| OVERALL | 0.42 | 0.44 | 1.41 | 1.00 | 49,544 | 442,404 |
| Region | Drilling LTIR | Work hours (thousands) | ||||
|---|---|---|---|---|---|---|
| Company | Contractor | 2023 | ||||
| 2018-2022 | 2023 | 2018-2022 | 2023 | Company | Contractor | |
| Africa | 0.16 | 0.00 | 0.20 | 0.21 | 3,225 | 38,094 |
| Asia/Australasia | 0.03 | 0.00 | 0.20 | 0.13 | 21,911 | 154,930 |
| Europe | 0.47 | 0.14 | 1.64 | 0.99 | 7,188 | 25,204 |
| Middle East | 0.14 | 0.20 | 0.17 | 0.26 | 5,065 | 117,571 |
| North America | 0.25 | 0.45 | 0.47 | 0.28 | 26,627 | 67,152 |
| Russia & Central Asia | 0.43 | 0.54 | 0.38 | 0.82 | 3,670 | 6,112 |
| South & Central America | 0.06 | 0.00 | 0.63 | 0.73 | 5,160 | 45,146 |
| OVERALL | 0.18 | 0.22 | 0.38 | 0.31 | 72,848 | 454,213 |
| Region | Production TRIR | Work hours (thousands) | ||||
|---|---|---|---|---|---|---|
| Company | Contractor | 2023 | ||||
| 2018-2022 | 2023 | 2018-2022 | 2023 | Company | Contractor | |
| Africa | 0.25 | 0.17 | 0.43 | 0.60 | 23,850 | 127,635 |
| Asia/Australasia | 0.54 | 0.43 | 0.60 | 0.54 | 83,084 | 249,616 |
| Europe | 1.36 | 1.75 | 2.49 | 3.67 | 58,761 | 58,821 |
| Middle East | 0.29 | 0.22 | 0.29 | 0.22 | 71,319 | 358,660 |
| North America | 1.72 | 1.45 | 1.24 | 1.06 | 49,765 | 204,627 |
| Russia & Central Asia | 0.42 | 0.68 | 0.41 | 0.59 | 116,751 | 66,163 |
| South & Central America | 0.77 | 0.52 | 1.42 | 1.28 | 36,455 | 169,066 |
| OVERALL | 0.71 | 0.75 | 0.85 | 0.79 | 439,988 | 1,234,590 |
| Region | Production LTIR | Work hours (thousands) | ||||
|---|---|---|---|---|---|---|
| Company | Contractor | 2023 | ||||
| 2018-2022 | 2023 | 2018-2022 | 2023 | Company | Contractor | |
| Africa | 0.09 | 0.08 | 0.12 | 0.22 | 23,850 | 127,635 |
| Asia/Australasia | 0.12 | 0.06 | 0.13 | 0.11 | 83,084 | 249,616 |
| Europe | 0.67 | 0.92 | 1.00 | 1.82 | 58,761 | 58,821 |
| Middle East | 0.09 | 0.07 | 0.09 | 0.09 | 71,319 | 358,660 |
| North America | 0.40 | 0.38 | 0.24 | 0.19 | 91,000 | 229,425 |
| Russia & Central Asia | 0.22 | 0.32 | 0.12 | 0.41 | 116,751 | 66,163 |
| South & Central America | 0.49 | 0.38 | 0.54 | 0.67 | 36,455 | 169,066 |
| OVERALL | 0.28 | 0.32 | 0.26 | 0.30 | 481,223 | 1,259,388 |
| Region | Construction TRIR | Work hours (thousands) | ||||
|---|---|---|---|---|---|---|
| Company | Contractor | 2023 | ||||
| 2018-2022 | 2023 | 2018-2022 | 2023 | Company | Contractor | |
| Africa | 0.13 | 0.00 | 0.40 | 0.32 | 5,675 | 66,131 |
| Asia/Australasia | 0.36 | 0.58 | 0.57 | 0.99 | 17,352 | 67,759 |
| Europe | 0.35 | 0.28 | 2.78 | 2.31 | 7,269 | 17,746 |
| Middle East | 0.46 | 0.31 | 0.42 | 0.52 | 12,738 | 450,800 |
| North America | 0.43 | 0.73 | 1.65 | 1.31 | 2,727 | 21,365 |
| Russia & Central Asia | 1.40 | 0.84 | 0.60 | 0.38 | 7,104 | 10,432 |
| South & Central America | 0.09 | 0.16 | 1.24 | 0.78 | 6,152 | 55,351 |
| OVERALL | 0.56 | 0.42 | 0.71 | 0.64 | 59,020 | 689,587 |
| Region | Construction LTIR | Work hours (thousands) | ||||
|---|---|---|---|---|---|---|
| Company | Contractor | 2023 | ||||
| 2018-2022 | 2023 | 2018-2022 | 2023 | Company | Contractor | |
| Africa | 0.04 | 0.00 | 0.15 | 0.15 | 5,675 | 66,131 |
| Asia/Australasia | 0.04 | 0.17 | 0.08 | 0.16 | 17,352 | 67,759 |
| Europe | 0.19 | 0.00 | 0.77 | 0.90 | 7,269 | 17,746 |
| Middle East | 0.15 | 0.08 | 0.07 | 0.12 | 12,738 | 450,800 |
| North America | 0.12 | 0.37 | 0.11 | 0.14 | 2,727 | 21,365 |
| Russia & Central Asia | 0.44 | 0.28 | 0.09 | 0.29 | 7,104 | 10,432 |
| South & Central America | 0.03 | 0.00 | 0.45 | 0.20 | 6,152 | 55,351 |
| OVERALL | 0.17 | 0.12 | 0.15 | 0.15 | 59,020 | 689,587 |
| Region | Unspecified TRIR | Work hours (thousands) | ||||
|---|---|---|---|---|---|---|
| Company | Contractor | 2023 | ||||
| 2018-2022 | 2023 | 2018-2022 | 2023 | Company | Contractor | |
| Africa | 0.07 | 0.43 | 0.21 | 0.71 | 25,657 | 100,245 |
| Asia/Australasia | 0.39 | 0.40 | 1.05 | 1.47 | 104,970 | 79,180 |
| Europe | 0.27 | 0.32 | 1.11 | 2.16 | 21,792 | 13,433 |
| Middle East | 0.31 | 0.42 | 0.32 | 0.28 | 35,669 | 148,502 |
| North America | 0.47 | 0.38 | 1.66 | 1.99 | 33,886 | 56,203 |
| Russia & Central Asia | 0.36 | 0.20 | 0.37 | 0.98 | 4,893 | 14,218 |
| South & Central America | 0.17 | 0.07 | 1.16 | 1.10 | 14,053 | 13,615 |
| OVERALL | 0.33 | 0.37 | 0.76 | 0.94 | 240,923 | 425,398 |
| Region | Unspecified LTIR | Work hours (thousands) | ||||
|---|---|---|---|---|---|---|
| Company | Contractor | 2023 | ||||
| 2018-2022 | 2023 | 2018-2022 | 2023 | Company | Contractor | |
| Africa | 0.06 | 0.16 | 0.11 | 0.22 | 25,657 | 100,245 |
| Asia/Australasia | 0.10 | 0.10 | 0.13 | 0.25 | 104,970 | 79,180 |
| Europe | 0.16 | 0.09 | 0.32 | 1.04 | 21,792 | 13,433 |
| Middle East | 0.10 | 0.11 | 0.08 | 0.11 | 35,669 | 148,502 |
| North America | 0.13 | 0.23 | 0.44 | 0.32 | 64,571 | 120,034 |
| Russia & Central Asia | 0.21 | 0.00 | 0.13 | 0.35 | 4,893 | 14,218 |
| South & Central America | 0.01 | 0.00 | 0.37 | 0.59 | 14,053 | 13,615 |
| OVERALL | 0.12 | 0.13 | 0.19 | 0.25 | 271,608 | 489,229 |
Section 5 Results by company
| Company code 2023 | FAR | TRIR | LTIR | ||||
|---|---|---|---|---|---|---|---|
| FAR total | TRIR total | Company only | Contractor only | LTIR total | Company only | Contractor only | |
| Overall | 1.35 | 0.75 | 0.58 | 0.80 | 0.25 | 0.23 | 0.26 |
| A | 0.00 | 2.02 | 1.34 | 5.89 | 2.02 | 1.34 | 5.89 |
| B | 0.00 | 1.38 | 0.90 | 1.59 | 1.38 | 0.90 | 1.59 |
| C | 0.00 | 1.80 | 0.00 | 3.42 | 1.35 | 0.00 | 2.57 |
| D | 0.00 | 2.93 | 0.89 | 3.98 | 1.05 | 0.22 | 1.48 |
| E | 0.00 | 1.31 | 1.77 | 1.12 | 1.05 | 0.88 | 1.12 |
| F | 0.00 | 1.70 | 0.00 | 2.28 | 1.02 | 0.00 | 1.37 |
| G | 0.00 | 2.05 | 0.58 | 3.23 | 0.94 | 0.58 | 1.23 |
| H | 0.00 | 2.13 | 1.62 | 2.34 | 0.91 | 0.62 | 1.04 |
| I | 2.33 | 1.89 | 1.75 | 1.93 | 0.79 | 0.76 | 0.80 |
| J | 38.87 | 1.07 | 0.66 | 1.40 | 0.78 | 0.66 | 0.87 |
| K | 0.00 | 3.00 | 0.22 | 8.81 | 0.75 | 0.00 | 2.32 |
| L | 0.46 | 1.13 | 0.37 | 1.31 | 0.61 | 0.34 | 0.68 |
| M | 0.00 | 1.08 | 0.56 | 1.38 | 0.47 | 0.19 | 0.63 |
| N | 0.00 | 1.32 | 0.88 | 2.04 | 0.47 | 0.32 | 0.71 |
| O | 2.00 | 1.15 | 0.71 | 1.39 | 0.43 | 0.21 | 0.55 |
| P | 0.00 | 1.61 | 1.25 | 1.69 | 0.42 | 0.44 | 0.42 |
| Q | 11.74 | 0.78 | 0.27 | 0.87 | 0.39 | 0.27 | 0.41 |
| S | 7.54 | 0.37 | 0.23 | 0.51 | 0.37 | 0.23 | 0.51 |
| T | 0.00 | 2.05 | 1.53 | 2.21 | 0.36 | 0.51 | 0.32 |
| U | 1.10 | 1.02 | 0.40 | 1.17 | 0.36 | 0.17 | 0.41 |
| V | 0.00 | 0.65 | 0.62 | 0.66 | 0.32 | 0.22 | 0.34 |
| W | 2.81 | 1.24 | 0.47 | 1.45 | 0.30 | 0.09 | 0.36 |
| Y | 0.00 | 0.46 | 0.37 | 0.55 | 0.28 | 0.28 | 0.28 |
| Z | 0.00 | 1.65 | 0.61 | 2.22 | 0.26 | 0.00 | 0.40 |
| BB | 0.00 | 0.76 | 1.07 | 0.71 | 0.21 | 0.38 | 0.17 |
| CC | 0.93 | 0.19 | 0.34 | 0.07 | |||
| DD | 4.21 | 0.77 | 0.65 | 0.92 | 0.19 | 0.17 | 0.21 |
| EE | 0.00 | 0.36 | 0.35 | 0.36 | 0.18 | 0.28 | 0.15 |
| FF | 0.00 | 0.77 | 0.30 | 0.79 | 0.18 | 0.07 | 0.18 |
| GG | 0.69 | 1.41 | 0.92 | 1.53 | 0.14 | 0.11 | 0.15 |
| HH | 0.00 | 1.63 | 0.54 | 2.86 | 0.14 | 0.00 | 0.30 |
| II | 0.00 | 1.62 | 0.69 | 1.85 | 0.14 | 0.10 | 0.15 |
| JJ | 3.93 | 0.28 | 0.32 | 0.27 | 0.12 | 0.00 | 0.14 |
| KK | 1.70 | 0.54 | 0.22 | 0.64 | 0.12 | 0.07 | 0.13 |
| LL | 3.33 | 0.20 | 0.00 | 0.21 | 0.12 | 0.00 | 0.12 |
| MM | 0.00 | 0.51 | 0.50 | 0.51 | 0.09 | 0.00 | 0.12 |
| NN | 0.94 | 0.31 | 0.16 | 0.36 | 0.09 | 0.08 | 0.10 |
| OO | 0.21 | 0.10 | 0.15 | 0.10 | 0.05 | 0.06 | 0.05 |
| PP | 0.00 | 0.45 | 1.12 | 0.31 | 0.05 | 0.00 | 0.06 |
| 0.00 | 0.24 | 0.00 | 0.28 | 0.05 | 0.00 | 0.06 | |
| RR | 2.19 | 0.12 | 0.03 | 0.13 | 0.04 | 0.03 | 0.04 |
| SS | 0.00 | 0.50 | 0.00 | 0.52 | 0.00 | 0.00 | 0.00 |
| TT | 0.00 | 1.32 | 0.34 | 1.81 | 0.00 | 0.00 | 0.00 |
| UU | 0.00 | 1.12 | 0.00 | 1.53 | 0.00 | 0.00 | 0.00 |
| VV | 0.00 | 0.31 | 0.33 | 0.29 | 0.00 | 0.00 | 0.00 |
| WW | 0.00 | 2.30 | 0.00 | 2.72 | 0.00 | 0.00 | 0.00 |
| XX | 0.00 | 0.19 | 0.00 | 0.26 | 0.00 | 0.00 | 0.00 |
| YY | 0.00 | 0.00 | 0.00 | 0.00 | 0.00 | 0.00 | 0.00 |
| ZZ | 0.00 | 0.54 | 0.00 | 0.92 | 0.00 | 0.00 | 0.00 |
| AAA | 0.00 | 1.02 | 0.00 | 1.32 | 0.00 | 0.00 | 0.00 |
| BBB | 0.00 | 0.47 | 0.58 | 0.44 | 0.00 | 0.00 | 0.00 |
| Company code | TRIR (2023) | |||
|---|---|---|---|---|
| Exploration | Drilling | Production | Construction | |
| Overall | 0.31 | 0.94 | 0.78 | 0.62 |
| A | 5.89 | 1.34 | ||
| B | 0.00 | 2.90 | 2.94 | 0.00 |
| C | 3.11 | |||
| D | 0.00 | 5.42 | 2.67 | 7.07 |
| E | 1.15 | 1.36 | ||
| F | ||||
| G | 0.00 | 4.32 | 2.12 | 1.70 |
| H | 0.38 | 2.07 | 3.40 | 0.67 |
| I | ||||
| J | 0.00 | 2.08 | 1.14 | 1.93 |
| K | 3.00 | |||
| L | 1.80 | 1.87 | 1.08 | 0.82 |
| M | 0.00 | 2.13 | 1.11 | 1.45 |
| N | 1.07 | 1.62 | 2.13 | |
| O | 1.04 | 2.28 | 1.67 | 0.81 |
| P | 1.60 | 2.58 | 1.57 | 0.92 |
| Q | 0.82 | 0.90 | 0.55 | |
| S | 0.37 | |||
| T | 2.11 | |||
| U | ||||
| V | 0.00 | 3.64 | 0.58 | 0.29 |
| W | 6.30 | 3.63 | 0.98 | 0.77 |
| Y | 0.46 | |||
| Z | 0.00 | 0.66 | 3.15 | 1.85 |
| BB | 0.76 | |||
| CC | ||||
| DD | ||||
| EE | 0.00 | 0.96 | 0.33 | 0.22 |
| FF | 0.61 | 0.39 | 0.87 | |
| GG | 0.00 | 1.69 | 1.56 | 0.31 |
| HH | 0.00 | 3.42 | 3.17 | |
| II | 0.00 | 2.33 | 1.12 | 2.17 |
| JJ | 0.13 | 1.02 | 0.14 | 0.19 |
| KK | 1.08 | 0.82 | 0.40 | 2.00 |
| LL | 0.44 | 0.19 | 0.27 | |
| MM | 0.00 | 0.43 | 0.61 | 0.80 |
| NN | 0.00 | 0.40 | 0.41 | 0.38 |
| OO | 0.00 | 0.27 | 0.10 | 0.02 |
| PP | ||||
| 0.00 | 0.00 | 0.44 | 0.00 | |
| RR | 0.00 | 0.09 | 0.15 | |
| SS | 0.51 | |||
| TT | 0.00 | 0.66 | 1.91 | |
| UU | 1.12 | |||
| VV | 0.33 | 0.00 | 0.00 | |
| WW | 0.00 | 5.89 | ||
| XX | 0.31 | 0.30 | 0.00 | |
| YY | ||||
| ZZ | 0.00 | 0.64 | 0.00 | |
| AAA | 0.00 | 1.08 | ||
| BBB | 0.47 | |||
| Company code | LTIR (2023) | |||
|---|---|---|---|---|
| Exploration | Drilling | Production | Construction | |
| Overall | 0.11 | 0.30 | 0.31 | 0.15 |
| A | 5.89 | 1.34 | ||
| B | 0.00 | 2.90 | 2.94 | 0.00 |
| C | 2.33 | |||
| D | 0.00 | 0.00 | 1.25 | 3.93 |
| E | 1.15 | 1.02 | ||
| F | ||||
| G | 0.00 | 2.52 | 0.79 | 0.00 |
| H | 0.00 | 0.07 | 1.69 | 0.29 |
| I | ||||
| J | 0.00 | 0.00 | 1.01 | 0.00 |
| K | 0.75 | |||
| L | 0.77 | 1.16 | 0.64 | 0.16 |
| M | 0.00 | 0.85 | 0.56 | 0.00 |
| N | 0.72 | 0.57 | 0.43 | |
| O | 1.04 | 0.78 | 0.65 | 0.28 |
| P | 0.00 | 0.67 | 0.50 | 0.00 |
| Q | 0.00 | 0.49 | 0.28 | |
| S | 0.37 | |||
| T | 0.37 | |||
| U | ||||
| V | 0.00 | 2.24 | 0.19 | 0.09 |
| W | 1.58 | 0.80 | 0.46 | 0.19 |
| Y | 0.28 | |||
| Z | 0.00 | 0.66 | 0.55 | 0.13 |
| BB | 0.21 | |||
| CC | 0.05 | 0.34 | 0.20 | |
| DD | ||||
| EE | 0.00 | 0.28 | 0.26 | 0.06 |
| FF | 0.24 | 0.16 | 0.18 | |
| GG | 0.00 | 0.15 | 0.18 | 0.00 |
| HH | 0.00 | 0.38 | 0.00 | |
| II | 0.00 | 0.23 | 0.08 | 0.27 |
| JJ | 0.13 | 0.37 | 0.09 | 0.12 |
| KK | 1.08 | 0.18 | 0.08 | 0.33 |
| LL | 0.44 | 0.04 | 0.21 | |
| MM | 0.00 | 0.22 | 0.06 | 0.27 |
| NN | 0.00 | 0.13 | 0.14 | 0.11 |
| OO | 0.00 | 0.17 | 0.05 | 0.02 |
| PP | ||||
| 0.00 | 0.00 | 0.09 | 0.00 | |
| RR | 0.00 | 0.04 | 0.04 | |
| SS | 0.00 | |||
| TT | 0.00 | 0.00 | 0.00 | |
| UU | 0.00 | |||
| VV | 0.00 | 0.00 | 0.00 | |
| WW | 0.00 | 0.00 | ||
| XX | 0.00 | 0.00 | 0.00 | |
| YY | ||||
| ZZ | 0.00 | 0.00 | 0.00 | |
| AAA | 0.00 | 0.00 | ||
| BBB | 0.00 | |||
Database dimensions (Appendix A)
| Year | Work hours reported (thousands) | Participating companies | ||
|---|---|---|---|---|
| Overall | Company | Contractor | ||
| 1985 | 655,650 | 410,409 | 245,241 | 22 |
| 1986 | 544,053 | 305,637 | 238,416 | 26 |
| 1987 | 602,480 | 355,578 | 246,902 | 30 |
| 1988 | 616,448 | 363,530 | 252,918 | 35 |
| 1989 | 655,945 | 330,970 | 324,975 | 33 |
| 1990 | 720,652 | 331,986 | 388,666 | 31 |
| 1991 | 940,538 | 441,141 | 499,397 | 36 |
| 1992 | 944,143 | 431,139 | 513,004 | 33 |
| 1993 | 919,176 | 410,474 | 508,702 | 35 |
| 1994 | 871,973 | 397,258 | 474,715 | 30 |
| 1995 | 840,811 | 355,695 | 485,186 | 30 |
| 1996 | 911,540 | 360,149 | 551,391 | 36 |
| 1997 | 1,161,335 | 389,442 | 771,893 | 40 |
| 1998 | 1,131,229 | 385,619 | 745,610 | 41 |
| 1999 | 1,197,460 | 395,141 | 802,319 | 40 |
| 2000 | 1,633,855 | 571,915 | 1,061,940 | 44 |
| 2001 | 1,976,646 | 633,039 | 1,343,607 | 41 |
| 2002 | 2,120,829 | 636,414 | 1,484,415 | 35 |
| 2003 | 2,247,026 | 663,894 | 1,583,132 | 36 |
| 2004 | 2,290,453 | 638,739 | 1,651,714 | 37 |
| 2005 | 2,380,670 | 639,292 | 1,741,378 | 39 |
| 2006 | 2,936,974 | 734,425 | 2,202,549 | 41 |
| 2007 | 2,912,801 | 667,986 | 2,244,815 | 38 |
| 2008 | 3,304,168 | 712,482 | 2,591,686 | 39 |
| 2009 | 3,585,842 | 822,240 | 2,763,602 | 43 |
| 2010 | 3,411,144 | 725,673 | 2,685,471 | 42 |
| 2011 | 3,456,078 | 753,100 | 2,702,978 | 45 |
| 2012 | 3,691,040 | 759,600 | 2,931,440 | 49 |
| 2013 | 3,770,546 | 820,856 | 2,949,690 | 50 |
| 2014 | 4,365,959 | 945,572 | 3,420,387 | 52 |
| 2015 | 3,719,316 | 896,862 | 2,822,454 | 49 |
| 2016 | 2,895,621 | 667,335 | 2,228,286 | 43 |
| 2017 | 2,999,039 | 688,779 | 2,310,260 | 45 |
| 2018 | 3,066,350 | 653,764 | 2,412,586 | 46 |
| 2019 | 3,038,352 | 657,258 | 2,381,094 | 48 |
| 2020 | 2,544,201 | 708,712 | 1,835,489 | 48 |
| 2021 | 2,679,026 | 686,668 | 1,992,358 | 50 |
| 2022 | 2,579,000 | 659,717 | 1,919,283 | 51 |
| 2023 | 3,291,382 | 881,802 | 2,409,580 | 58 |
| 2024 | 4,158,877 | 1,060,726 | 3,098,151 | 56 |
| 2025 | 3,852,334 | 902,941 | 2,949,393 | 56 |
| Region | Hours (thousands) | |
|---|---|---|
| 2022 | 2023 | |
| Africa | 478,530 | 392,253 |
| Asia/Australasia | 877,373 | 786,218 |
| Europe | 230,398 | 215,038 |
| Middle East | 1,170,824 | 1,234,235 |
| North America | 756,140 | 644,440 |
| Russia & Central Asia | 228,189 | 230,872 |
| South & Central America | 417,421 | 349,275 |
| OVERALL | 4,158,877 | 3,852,334 |
| Function | Hours (thousands) | |
|---|---|---|
| 2022 | 2023 | |
| Exploration | 55,709 | 75,214 |
| Drilling | 714,524 | 527,062 |
| Production | 1,847,122 | 1,740,612 |
| Construction | 804,614 | 748,608 |
| Unspecified | 736,907 | 760,837 |
| OVERALL | 4,158,877 | 3,852,334 |
Appendix C - Contributing companies
Table C.1 shows the size of the database in thousands of work hours reported for each contributing company and whether reported data include information on contractor statistics, breakdown by function, restricted work day cases, days lost following lost work day, and restricted work day cases. All company submissions include data on numbers of fatalities and lost work day cases.
| Company | Hours (thousands) | Contractor data | Data by function | RWDCs | LWDC days | RWDC days |
|---|---|---|---|---|---|---|
| ADDAX Petroleum Limited | 1,974 | yes | mostly | yes | yes | yes |
| ADNOC | 379,757 | yes | mostly | yes | yes | yes |
| Aker BP | 9,113 | yes | mostly | yes | mostly | yes |
| Azule | 10,080 | yes | yes | yes | yes | mostly |
| Bapco Energies | 16,807 | yes | no | yes | yes | yes |
| Basrah Gas Company | 26,942 | yes | yes | yes | yes | yes |
| Beach Energy | 2,653 | yes | mostly | yes | yes | yes |
| BP | 72,662 | yes | yes | yes | no | no |
| BW Energy | 2,342 | yes | yes | yes | yes | yes |
| Capricorn Energy | 377 | no | yes | yes | yes | yes |
| CCED | 10,930 | yes | mostly | yes | yes | yes |
| Cenovus | 57,418 | yes | mostly | yes | no | no |
| CEPSA EP | 5,111 | yes | mostly | yes | yes | yes |
| Chevron | 245,535 | yes | mostly | yes | yes | yes |
| CNOOC | 200,064 | yes | mostly | yes | yes | mostly |
| ConocoPhillips | 107,820 | yes | mostly | yes | no | no |
| Crescent Petroleum | 10,665 | yes | yes | yes | yes | yes |
| Dana Gas | 3,859 | yes | yes | yes | yes | yes |
| Dolphin Energy | 6,722 | yes | yes | yes | yes | yes |
| ENI | 231,750 | yes | mostly | yes | yes | mostly |
| Equinor ASA | 105,011 | yes | yes | yes | no | no |
| ExxonMobil | 148,940 | yes | mostly | yes | yes | mostly |
| Genel Energy | 2,098 | yes | mostly | yes | yes | yes |
| Gulf Keystone | 1,841 | yes | yes | yes | yes | yes |
| Harbour Energy | 10,324 | yes | mostly | yes | yes | yes |
| Hess Corporation | 14,455 | yes | mostly | yes | no | no |
| INPEX Corporation | 13,845 | yes | mostly | yes | yes | mostly |
| KMG | 46,345 | no | yes | yes | yes | yes |
| Kosmos Energy | 944 | yes | partly | yes | yes | yes |
| Kuwait Oil Company | 188,315 | yes | mostly | yes | yes | mostly |
| MOL | 8,551 | yes | mostly | yes | yes | yes |
| Neptune Energy | 10,153 | yes | yes | yes | yes | yes |
| North Oil Company | 20,952 | yes | mostly | yes | yes | yes |
| OMV | 37,336 | yes | mostly | yes | yes | yes |
| ONGC | 57,756 | no | no | yes | yes | yes |
| Orlen | 11,500 | yes | yes | yes | yes | yes |
| Oxy | 88,986 | yes | no | yes | yes | yes |
| Pan American Energy | 26,288 | yes | mostly | yes | yes | yes |
| Petrobras | 197,911 | yes | mostly | yes | yes | yes |
| Petronas Carigali | 75,119 | yes | yes | yes | yes | mostly |
| Pluspetrol | 25,660 | yes | mostly | yes | yes | yes |
| Prime Energy | 2,010 | yes | yes | yes | yes | yes |
| PTTEP | 50,840 | yes | mostly | yes | yes | yes |
| Qatar Energy | 73,534 | yes | mostly | yes | mostly | mostly |
| Qatar Energy LNG | 165,299 | yes | mostly | yes | yes | yes |
| Repsol | 11,722 | yes | mostly | yes | yes | yes |
| Shell Companies | 188,106 | yes | mostly | yes | yes | yes |
| SOCAR | 83,131 | no | mostly | yes | yes | yes |
| Sonangol | 4,410 | yes | yes | yes | yes | yes |
| Spirit Energy | 2,249 | yes | mostly | yes | yes | yes |
| Suncor | 1,841 | yes | yes | yes | yes | yes |
| TotalEnergies | 104,283 | yes | mostly | yes | yes | no |
| Trident Energy | 5,498 | yes | yes | yes | yes | yes |
| Tullow Oil | 5,022 | yes | yes | yes | yes | yes |
| Vår Energy | 10,868 | yes | yes | yes | yes | yes |
| Wintershall Dea | 6,172 | yes | mostly | yes | yes | yes |
| Woodside | 20,915 | yes | partly | yes | yes | yes |
| YPF SA | 60,565 | yes | mostly | yes | partly | partly |
Yes = reported for all data rows | mostly = reported for more than 50% of data rows | partly = reported for less than 50% of data rows | no = not reported at all.
Appendix D - Countries represented
The figures and table below show the breakdown of reported hours worked in regions and countries. Also shown is the number of companies reporting data in each country. They do not necessarily show all hours worked in the exploration and production sectors of the oil and gas industry in each country.

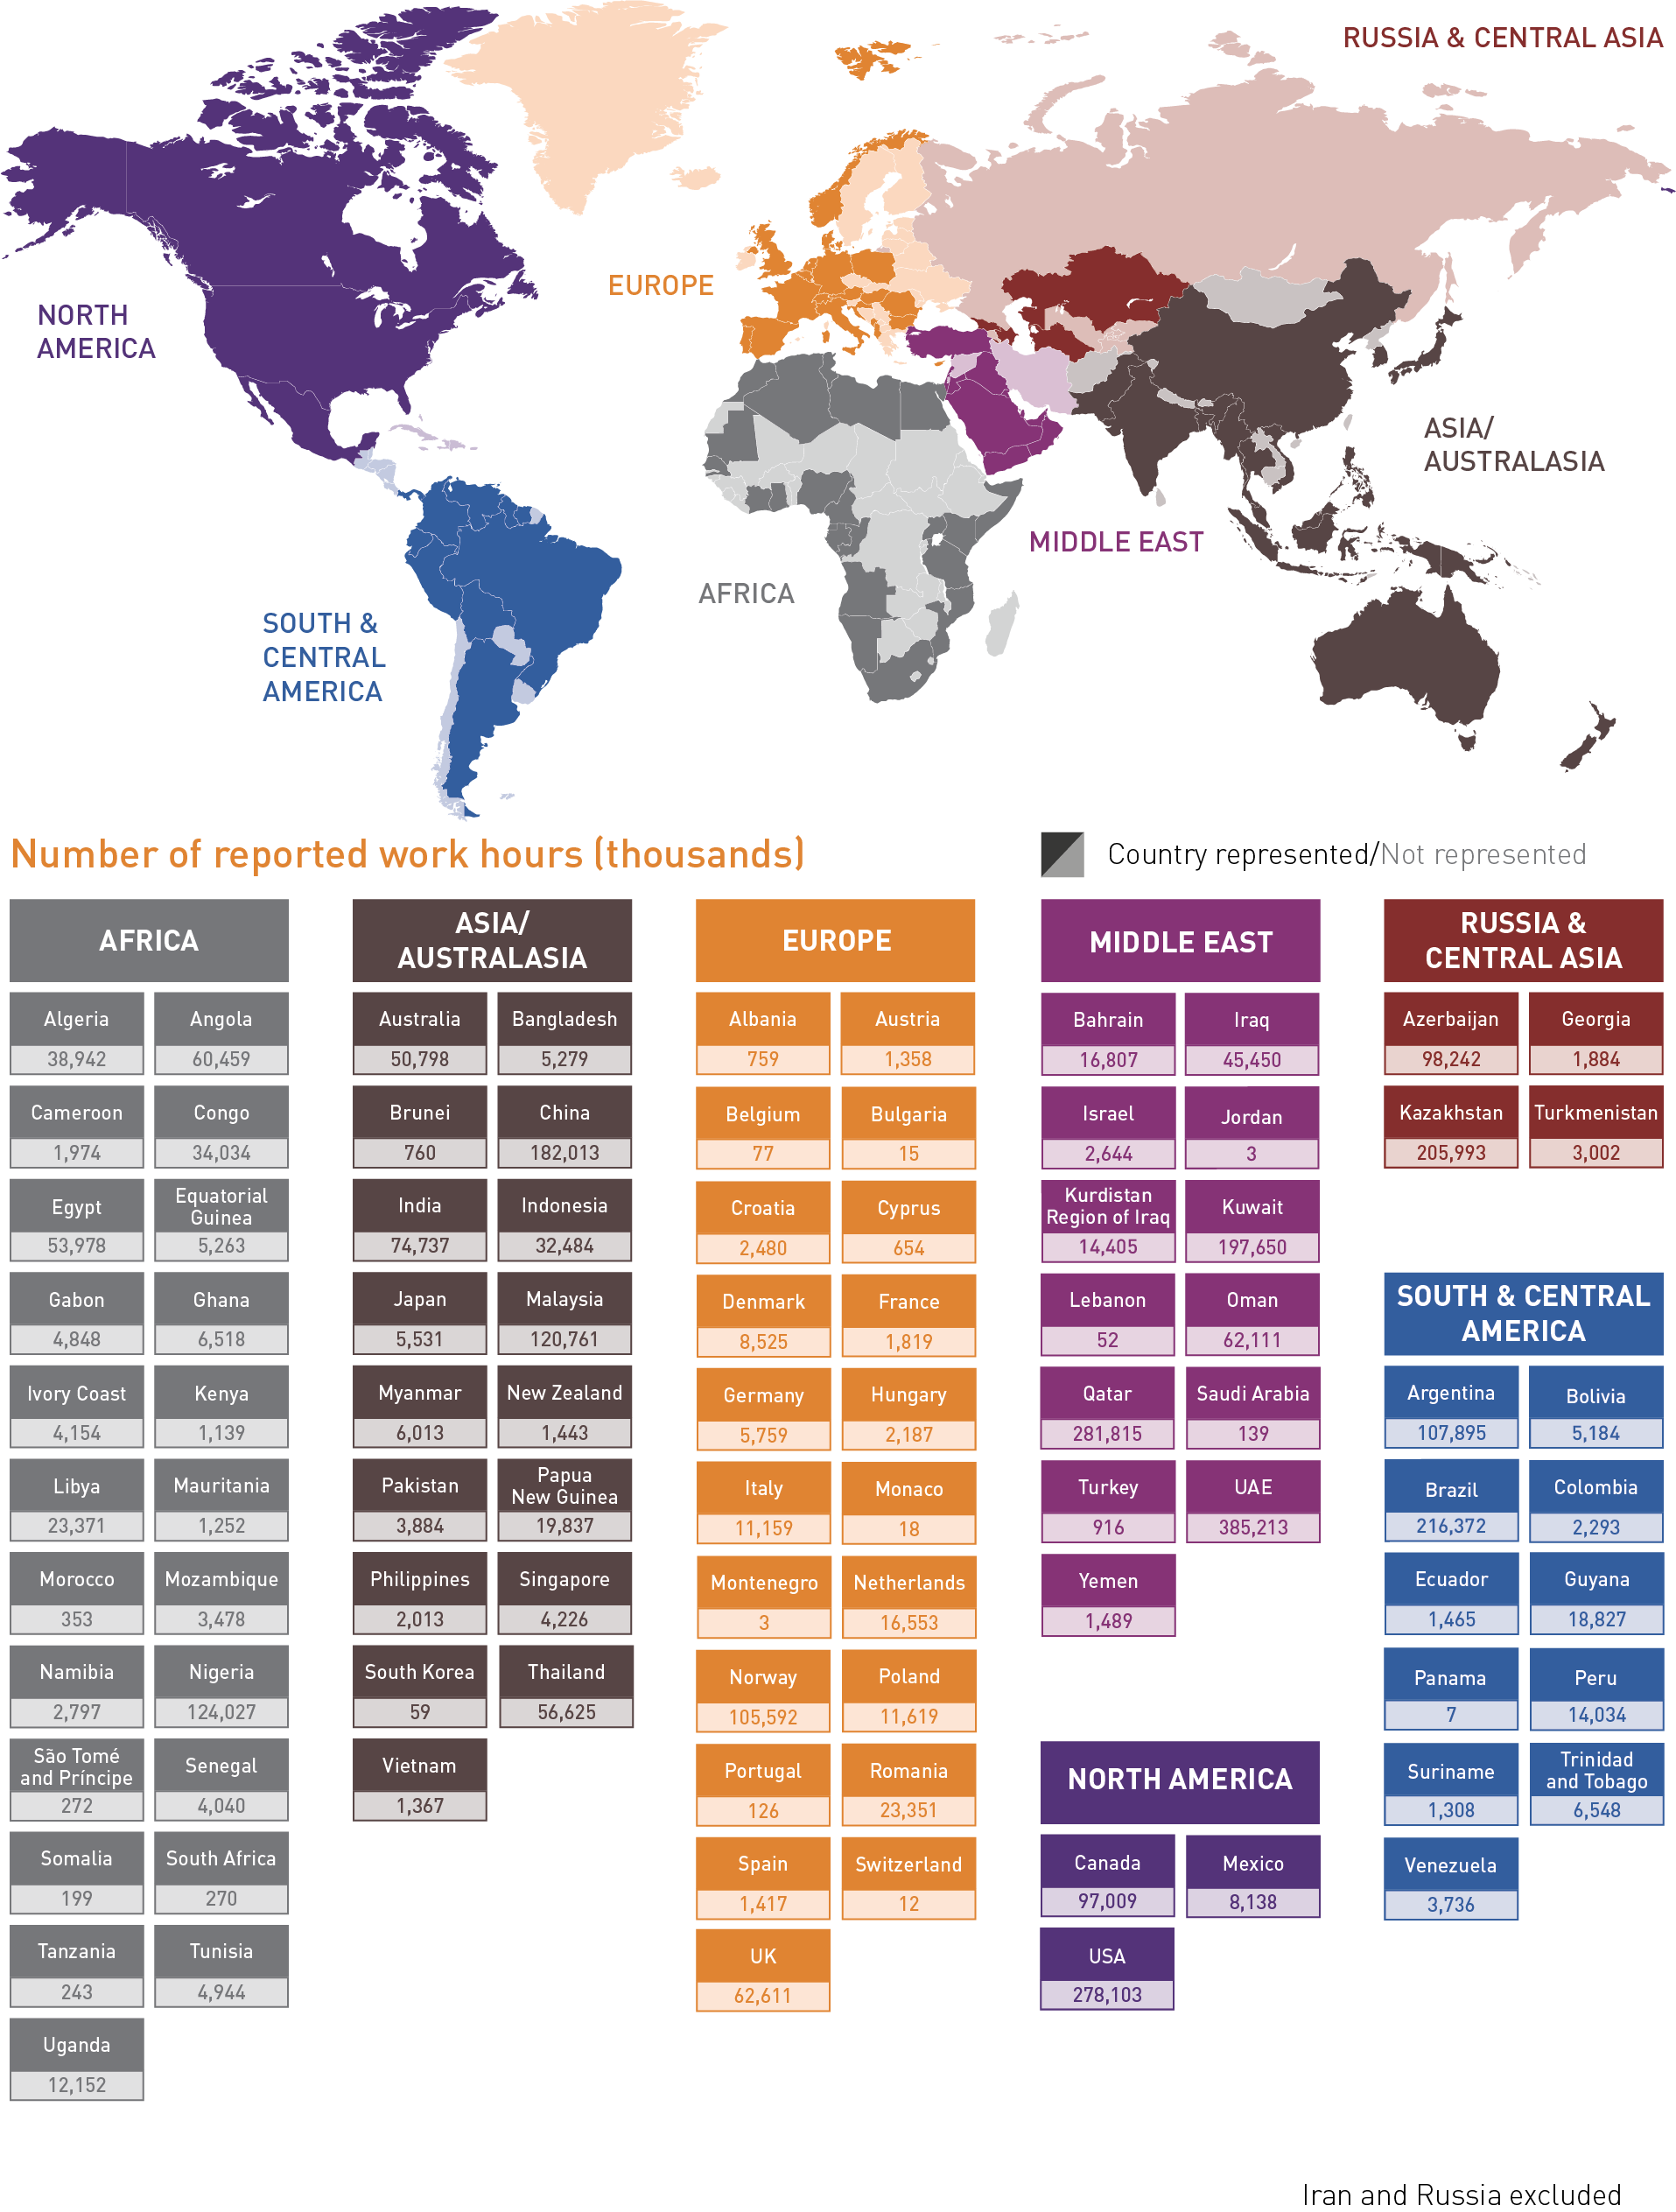
| Region | Country | Reporting companies (number) | Hours (thousands) |
|---|---|---|---|
| Africa | Algeria | 6 | 38,942 |
| Africa | Angola | 7 | 60,459 |
| Africa | Cameroon | 1 | 1,974 |
| Africa | Congo | 2 | 34,034 |
| Africa | Egypt | 10 | 53,978 |
| Africa | Equatorial Guinea | 4 | 5,263 |
| Africa | Gabon | 5 | 4,848 |
| Africa | Ghana | 3 | 6,518 |
| Africa | Ivory Coast | 3 | 4,154 |
| Africa | Kenya | 2 | 1,139 |
| Africa | Libya | 6 | 23,371 |
| Africa | Mauritania | 5 | 1,252 |
| Africa | Morocco | 1 | 353 |
| Africa | Mozambique | 3 | 3,478 |
| Africa | Namibia | 5 | 2,797 |
| Africa | Nigeria | 7 | 124,027 |
| Africa | São Tomé and Príncipe | 2 | 272 |
| Africa | Senegal | 4 | 4,040 |
| Africa | Somalia | 1 | 199 |
| Africa | South Africa | 2 | 270 |
| Africa | Tanzania | 2 | 243 |
| Africa | Tunisia | 2 | 4,944 |
| Africa | Uganda | 2 | 12,152 |
| Asia/Australasia | Australia | 11 | 50,798 |
| Asia/Australasia | Bangladesh | 1 | 5,279 |
| Asia/Australasia | Brunei | 2 | 760 |
| Asia/Australasia | China | 9 | 182,013 |
| Asia/Australasia | India | 4 | 74,737 |
| Asia/Australasia | Indonesia | 10 | 32,484 |
| Asia/Australasia | Japan | 3 | 5,531 |
| Asia/Australasia | Malaysia | 11 | 120,761 |
| Asia/Australasia | Myanmar | 2 | 6,013 |
| Asia/Australasia | New Zealand | 1 | 1,443 |
| Asia/Australasia | Pakistan | 1 | 3,884 |
| Asia/Australasia | Papua New Guinea | 2 | 19,837 |
| Asia/Australasia | Philippines | 3 | 2,013 |
| Asia/Australasia | Singapore | 8 | 4,226 |
| Asia/Australasia | South Korea | 3 | 59 |
| Asia/Australasia | Thailand | 5 | 56,625 |
| Asia/Australasia | Vietnam | 3 | 1,367 |
| Europe | Albania | 2 | 759 |
| Europe | Austria | 1 | 1,358 |
| Europe | Belgium | 1 | 77 |
| Europe | Bulgaria | 1 | 15 |
| Europe | Croatia | 1 | 2,480 |
| Europe | Cyprus | 4 | 654 |
| Europe | Denmark | 2 | 8,525 |
| Europe | France | 5 | 1,819 |
| Europe | Germany | 3 | 5,759 |
| Europe | Hungary | 1 | 2,187 |
| Europe | Italy | 4 | 11,159 |
| Europe | Monaco | 1 | 18 |
| Europe | Montenegro | 1 | 3 |
| Europe | Netherlands | 8 | 16,553 |
| Europe | Norway | 14 | 105,592 |
| Europe | Poland | 3 | 11,619 |
| Europe | Portugal | 1 | 126 |
| Europe | Romania | 2 | 23,351 |
| Europe | Spain | 2 | 1,417 |
| Europe | Switzerland | 2 | 12 |
| Europe | UK | 17 | 62,611 |
| Middle East | Bahrain | 1 | 16,807 |
| Middle East | Iraq | 6 | 45,450 |
| Middle East | Israel | 1 | 2,644 |
| Middle East | Jordan | 1 | 3 |
| Middle East | Kurdistan Region Of Iraq | 3 | 14,405 |
| Middle East | Kuwait | 3 | 197,650 |
| Middle East | Lebanon | 1 | 52 |
| Middle East | Oman | 6 | 62,111 |
| Middle East | Qatar | 8 | 281,815 |
| Middle East | Saudi Arabia | 1 | 139 |
| Middle East | Turkey | 1 | 916 |
| Middle East | UAE | 14 | 385,213 |
| Middle East | Yemen | 2 | 1,489 |
| North America | Canada | 12 | 97,009 |
| North America | Mexico | 11 | 8,138 |
| North America | USA | 15 | 278,103 |
| Russia & Central Asia | Azerbaijan | 5 | 98,242 |
| Russia & Central Asia | Georgia | 1 | 1,884 |
| Russia & Central Asia | Kazakhstan | 6 | 205,993 |
| Russia & Central Asia | Turkmenistan | 1 | 3,002 |
| South & Central America | Argentina | 11 | 107,895 |
| South & Central America | Bolivia | 6 | 5,184 |
| South & Central America | Brazil | 10 | 216,372 |
| South & Central America | Colombia | 5 | 2,293 |
| South & Central America | Ecuador | 1 | 1,465 |
| South & Central America | Guyana | 4 | 18,827 |
| South & Central America | Panama | 1 | 7 |
| South & Central America | Peru | 3 | 14,034 |
| South & Central America | Suriname | 2 | 1,308 |
| South & Central America | Trinidad and Tobago | 4 | 6,548 |
| South & Central America | Venezuela | 3 | 3,736 |
Appendix E - Glossary of terms
Assault and violent act (as an incident/event category)Intentional attempt, threat or act of bodily injury by a person or person(s) or by violent harmful actions of unknown intent, includes intentional acts of damage to property. |
Aviation accident (as an incident/event category)An occurrence associated with the operation of an aircraft which, in the case of a manned aircraft, takes place between the time any person boards the aircraft with the intention of flight until such time as all such persons have disembarked or, in the case of an unmanned aircraft, takes place between the time the aircraft is ready to move with the purpose of flight until such time as it comes to rest at the end of the flight and the primary propulsion system is shut down. |
Caught in, under or between (as an incident/event category)Injury where injured person is crushed or similarly injured between machinery moving parts or other objects, caught between rolling tubulars or objects being moved, crushed between a ship and a dock, or similar incidents. Also includes vehicle incidents involving a rollover. |
Causal factorsSee IOGP Safety data reporting users' guide. |
Commentary driveA training technique whereby the driver conducts a typical journey and, while driving, explains what hazards he/she sees or can anticipate in the road ahead, including unseen hazards, and what safe driving techniques they will or would utilize to eliminate or minimize the threat from such hazards. The driver is accompanied by a qualified instructor who assesses if the driver is employing the correct defensive driving techniques and proper seeing habits to identify and avoid driving hazards. At the end of drive, the assessor provides feedback and coaching to the driver on any areas of improvement. |
Commute travelFor injury/illness reporting, Commute travel begins when the worker is seated in the vehicle in preparation for departure and ends when the worker arrives at their home or worksite and the vehicle is placed in park or taken out of gear. For MVC reporting, Commute travel begins when the worker is no longer driving on company business. Note: Travel to and from field operations locations is considered to be company business travel. A vehicle crash is considered to have occurred during commute travel if it meets the definition above, regardless of whether the event occurs while driving a company or personal vehicle or whether the employee or contract employee is being compensated during this time. Where appropriate, any vehicle crash occurring during Commute travel may be considered as asset or property damage but not as an MVC. Note: All work-related travel performed by workers that are home-based, i.e., work from their place of residence, is considered to be company business travel. |
Commuting
|
Company employeeAny person employed by and on the payroll of the reporting company, including corporate and management personnel specifically involved in E&P. Persons employed under short-service contracts are included as company employees provided they are paid directly by the company. |
Confined space (as an incident/event category)Spaces that are considered confined because their configurations hinder the activities of employee who must enter, work in, and exit them. Confined spaces include, but are not limited to underground vaults, tanks, storage bins, manholes, pits, silos, process vessels and pipelines. |
Construction (as a work function)Major construction and fabrication activities as well as disassembly, removal and disposal (decommissioning) at the end of the facility life. Includes construction of process plant, yard construction of structures, offshore installation, hook-up and commissioning, and removal of redundant process facilities. |
Construction, commissioning, decommissioning (as a type of activity)Activities involving the construction, fabrication and installation of equipment, facilities or plant, testing activities to verify design objectives or specification, and also disassembly, removal and disposal (decommissioning) at the end of the facility life. |
Contracted (vehicle)See Owned, contracted or leased. |
ContractorA contractor is defined as an individual or organization performing work for the reporting company, following verbal or written agreement. Subcontractor is synonymous with contractor. |
Contractor employeeAny person employed by a contractor or contractor’s subcontractor(s) who is directly involved in execution of prescribed work under a contract with the reporting company. |
Cut, puncture, scrape (as an incident/event category)Abrasions, scratches and wounds that penetrate the skin. |
Diving operationsThe personnel, equipment and management systems to support a person who dives. A person dives if they enter water or any other liquid, or a chamber in which they are subject to pressure greater than 100 millibars above atmospheric pressure, and in order to survive in such an environment breathes air or other gas at a pressure greater than atmospheric pressure. Or for such a purpose uses a vehicle, capsule or suit where a sealed internal atmospheric pressure is maintained and where the external pressure differential is greater than 100 millibars. |
Diving, subsea, ROV (as a type of activity)Operations involving diving (see definition for diving operations), subsea equipment or activities and/or operations involving underwater remotely operated vehicles (ROV). |
Drilling (as a work function)All exploration, appraisal and production drilling, and workover as well as their administrative, engineering, construction, materials supply and transportation aspects. It includes site preparation, rigging up and down, and restoration of the drilling site upon work completion. Drilling includes all exploration, appraisal and production drilling. |
Drilling/workover/well services (as a type of activity)Activities involving the development, maintenance work or remedial treatments related to an oil or gas well. |
Dropped objects (as an incident/event category)Any item with the potential to cause injury, death, or equipment/environmental damage, that falls down or over from its previous position. Specifically excludes falls from height (people). Source: Dropped Object Prevention Scheme, Recommended Practice http://www.dropsonline.org/assets/documents/DROPS-Recommended-Practice-2017.pdf |
EventAn unplanned or uncontrolled outcome of a business operation or activity that has or could have contributed to an injury or physical damage or environmental damage. |
Excavation, trenching, ground disturbance (as a type of activity)Work that involves a cut, cavity, trench or depression in the earth’s surface formed by earth removal. |
Exploration (as a work function)Geophysical, seismographic and geological operations, including their administrative and engineering aspects, construction, maintenance, materials supply, and transportation of personnel and equipment (excluding drilling). |
Explosion or Burn (as an incident/event category)Burns or other effects of fires, explosions and extremes of temperature. ‘Explosion’ means a rapid combustion, not an overpressure. |
Exposure: Electrical (as an incident/event category)Exposure to electrical shock or electrical burns etc. |
Exposure: Noise, Chemical, Biological, Vibration (as an incident/event category)Exposure to noise, chemical substances (including asphyxiation due to lack of oxygen not associated with a confined space), hazardous biological material, vibration or radiation. |
Falls from height (as an incident/event category)A person falls from one level to another or event is related to work at height. |
Fatal Accident Rate (FAR)The number of company/contractor fatalities per 100 000 000 (100 million) hours worked. |
Fatal incident rate (FIR)The number of incidents that result in one or more fatalities per 100 million hours worked. |
FatalityCases that involve one or more people who died as a result of a work-related incident. |
Fatigue (as a causal factor)Person(s) involved were mentally tired for whatever reason e.g., excessive work hours, shift patterns, staffing levels insufficient, ill-health etc. The loss of situational awareness, task fixation, distraction, and mental fatigue due to sleep loss are examples of conditions that apply to this causal factor. |
First Aid CaseCases that are not sufficiently serious to be reported as medical treatment or more serious cases but nevertheless require minor first aid treatment, e.g., dressing on a minor cut, removal of a splinter from a finger. First aid cases are not recordable incidents. |
High Potential EventA high potential event is an event which could have, under slightly different circumstances, realistically resulted in a fatal incident. |
Home away from homeWhen travelling, workers establish a ‘home away from home’ when checked into a hotel, motel, or other similar temporary residence. Travel directly to the temporary residence before check-in from the airport (train station, etc.) or rental car agency and travel direct from home to the temporary residence is considered business travel, when on work-related business. Travel home directly from the temporary residence after checkout to the airport (train station, etc.) or rental car agency and travel direct to home from the temporary residence is considered business travel, when on work-related business. Company mandated accommodation is not considered to be home away from home. This is considered to be a field operations location therefore travel to and from such locations is considered to be company business travel and not a commute. |
Hours WorkedThe actual hours worked, including overtime hours, are recorded in the case of onshore operations. The hours worked by an individual will generally be about 2,000 per year. For offshore workers, the hours worked are calculated on a 12-hour work day. Consequently, average hours worked per year will vary from 1,600 to 2,300 hours per person depending upon the on/off shift ratio. Vacations and leave are excluded. |
Hours Worked in Year (thousands)Hours are rounded to the nearest thousand. |
IncidentAn unplanned or uncontrolled Event or chain of Events that has resulted in at least one fatality, recordable injury, or physical or environmental damage. |
Key performance indicators (KPI)Information or data that provides evidence of a Company’s performance in managing its key risks. KPIs may also be referred to as performance metrics. In the Safety Performance Indicators report, these include: number of fatalities, fatal accident and incident rates, lost time injury rate and total recordable injury rate. |
Lifting, crane, rigging, deck operations (as a type of activity)Activities related to the use of mechanical lifting and hoisting equipment, assembling and disassembling drilling rig equipment and drill pipe handling on the rig floor. |
Lost Time Injury (LTI)A fatality or lost work day case. The number of LTIs is the sum of fatalities and lost work day cases. |
Lost time injury rate (LTIR)The number of lost time injuries (fatalities + lost work day cases) per 1,000,000 hours worked. |
Lost Work Day Case (LWDC)Any work-related injury, other than a fatal injury, which results in a person being unfit for work on any day after the day of occurrence of the occupational injury. “Any day” includes rest days, weekend days, leave days, public holidays or days after ceasing employment. |
LWDC severityThe average number of lost days per lost work day case. |
Maintenance, inspection and testing (as a type of activity)Activities related to preserving, repairing, examining and function testing assets, equipment, plant or facilities. |
Manual handlingUse of human force to lift, lower, push, pull, carry, hold, or restrain an object, |
Medical Cause of DeathThis is the cause of death given on the death certificate. Where two types of causes are provided, such as “pulmonary oedema” caused by “inhalation of hot gases from a fire”, both are recorded. |
Medical Treatment Case (MTC)Cases that are not severe enough to be reported as lost work day cases or restricted work day cases but are more severe than requiring simple first aid treatment. |
Motor Vehicle Crash (MVC)A work-related motor vehicle incident, e.g., collision or other event, which resulted in vehicle damage, or vehicle rollover, or personal injury, or fatality. Note: Contractor Motor Vehicle Crash includes any vehicle operated by a contractor or subcontractor while performing work on behalf of the company, where injuries, kilometres driven, or hours worked should be recorded (e.g., delivery/courier services are excluded). |
Near MissAn unplanned or uncontrolled event or chain of events that has not resulted in recordable injury or physical damage or environmental damage but had the potential to do so in other circumstances. |
Number of days unfit for workThe sum total of calendar days (consecutive or otherwise) after the days on which the occupational injuries occurred, where the persons involved were unfit for work and did not work. |
Number of EmployeesAverage number of full-time and part-time employees involved in exploration and production, calculated on a full-time basis, during the reporting year. For example 2 part time employees each working 20 - 30 hours per week is equivalent to 1 full time employee. |
Number of FatalitiesThe total number of Company employees and/or Contractor employees who died as a result of an incident. Delayed deaths that occur after the incident are included if the deaths were a direct result of the incident. For example, if a fire killed one person outright, and a second died three weeks later from lung damage caused by the fire, both are reported. |
Occupational IllnessAny abnormal condition or disorder, or any fatality other than one resulting from an occupational injury, caused by exposure to environmental factors associated with employment. Occupational illness may be caused by inhalation, absorption, ingestion of, or direct contact with the hazard, as well as exposure to physical and psychological hazards. It will generally result from prolonged or repeated exposure. Refer to IOGP/IPIECA Report 393 - Health Performance Indicators. |
Occupational InjuryAny bodily harm such as a cut, sprain, fracture, amputation, respiratory distress, etc., which results from a work-related activity or from an exposure involving a single incident in the work environment, such as deafness from explosion, respiratory or skin symptoms from one-time chemical exposure, back disorder from a slip/trip, insect or snake bite, or electric shock. |
Office, warehouse, accommodation, catering (as a type of activity)Activities related to work conducted in offices, warehouses, workshops, accommodation and catering facilities. |
Officially declared [From API RP 754]A declaration by a recognized community official (e.g. fire, police, civil defence, emergency management) or delegate (e.g. Company official) authorized to order the community action (e.g. shelter-in-place, evacuation). |
Off-roadA route used for access to places which are not accessible by a road, (see ‘Road’). |
Offshore WorkAll activities and operations that take place at sea, including activities in bays, in major inland seas, such as the Caspian Sea, or in other inland seas directly connected to oceans. Incidents including transportation of people and equipment from shore to the offshore location, either by vessel or helicopter, should be recorded as “offshore”. |
Onshore WorkAll activities and operations that take place within a landmass, including those on swamps, rivers and lakes. Land-to-land aircraft operations are counted as onshore, even though flights are over water. |
Other (as an incident/event category)Used to specify where an incident cannot be logically classed under any other category. In the case of incident activities, includes air transport incidents. |
Overexertion or Strain (as an incident/event category)Physical overexertion, e.g., muscle strain. |
Permanent Impairment (PI)A direct work-related injury outcome that prevents a return to the person’s previous (pre-incident) whole person function within 180 days as a result of an acute, single incident resulting in any of the following:
|
Pressure Release (as an incident/event category)Release of gas, liquid or object under pressure from a pressurized system. |
Production (as a work function)Petroleum and natural gas producing operations, including their administrative and engineering aspects, minor construction, repairs, maintenance and servicing, materials supply, and transportation of personnel and equipment. It covers all mainstream production operations including wireline. Gas processing activities with the primary intent of producing gas liquids for sale including:
|
Production operations (as a type of activity)Activities related to the extraction of hydrocarbons from source such as an oil or gas well or hydrocarbon bearing geological structure, including primary processing, storage and transport operations. Includes normal, start-up or shut-down operations. |
RecordableA type of event, incident, injury, release or other outcome which has been determined to meet or exceed definitions, criteria or thresholds for inclusion and classification in reported data. |
Restricted Work Day Case (RWDC)Any work-related injury other than a fatality or lost work day case which results in a person being unfit for full performance of the regular job on any day after the occupational injury. Work performed might be:
|
RoadA thoroughfare which has a prepared, graded and levelled surface designed for the conveyance of motor vehicles (see also ‘off-road’), such as:
|
RWDC SeverityThe average number of days of restricted work per restricted work day case. |
SabotageDeliberately destroy, damage, or obstruct (something). |
Seismic/survey operations (as a type of activity)Activities relating to the determination of sub-surface structures for the purpose of locating oil and gas deposits including geophysical and seismic data acquisition. |
Slips and Trips (at the same height) (as an incident/event category)Slips, trips and falls caused by falling over or onto something at the same height. |
Struck By (as an incident/event category)Incidents/events where injury results from being hit by moving equipment and machinery, or by flying or falling objects. Also includes vehicle incidents where the vehicle is struck by or struck against another object. |
Third Party [From API RP 754]Any individual other than an employee, contractor or subcontractor of the Company, e.g. visitors, non-contracted delivery drivers, residents. |
Total recordable injuriesThe sum of fatalities, lost work day cases, restricted work day cases and medical treatment cases. |
Total recordable injury rate (TRIR)The number of recordable injuries (fatalities + lost work day cases + restricted work day cases + medical treatment cases (MTC)) per million hours worked. Note when MTC are not reported by a company for a country the associated fatalities, lost work day cases and restricted work day cases are excluded from TRIR calculations. |
Transport – Air (as a type of activity)Involving aircraft, either fixed wing or helicopters. Injuries caused by accidents on the ground at airports are classified in one of the other categories. |
Transport – Land (as a type of activity)Involving motorized vehicles designed for transporting people and goods over land, e.g., cars, buses, trucks. Pedestrians struck by a vehicle are classified as land transport incidents. Incidents from a mobile crane would only be land transport incidents if the crane was being moved between locations. |
Transport - Water, including Marine Activity (as a type of activity)Involving vessels, equipment or boats designed for transporting people and goods over water (including inland, marine, ice roads and marsh/swamp), e.g., supply vessels, crew boats. |
Unspecified – Other (as a type of activity)Incidents that cannot be logically classed under other headings or where the activity is unknown. |
Unspecified (as a work function)Unspecified is used for the entry of data associated with office personnel whose work hours and incident data cannot be reasonably assigned to the administrative support of one of the function groupings of exploration, drilling, production or construction. Corporate overhead support personnel, such as finance or human resources staff, may be examples where work hours cannot be specifically assigned to a particular function. All other data that are not separated out by function are reported as unspecified. NOTE: Data for companies that did not split their data submission by work function are included in the ‘unspecified’ function. |
Unspecified (in general)Unless otherwise defined, data are categorized as unspecified where the requested breakdown is not available. No data provided. |
Water related/drowning (as an incident/event category)Incidents/events in which water played a significant role including drowning. |
Wilful damageWilful or malicious damage or destruction of the property of another. |
Work-Related InjurySee Occupational Injury. |

IOGP safety performance indicators - 2023 data summarizes the safety performance of Member Companies participating in the data collection programme. 3.3 billion work hours of data from 58 companies were analysed according to the following key performance indicators:
- number of fatalities
- fatal accident and incident rates
- total recordable injury rate, and
- lost time injury rate.
https://data.iogp.org